import pandas as pd
import numpy as np
import tqdm
from haversine import haversine
import plotly.express as px
import matplotlib.pyplot as plt
import warnings
warnings.simplefilter("ignore", np.ComplexWarning)
from IPython.display import HTMLImport
from matplotlib import cm
from pygsp import graphs, filters, plotting, utils
import plotly.graph_objects as go

import rpy2
import rpy2.robjects as ro
from rpy2.robjects.vectors import FloatVector
from rpy2.robjects.packages import importr
import warnings
warnings.filterwarnings("ignore")import pickleEarthquake
df= pd.read_csv('https://raw.githubusercontent.com/plotly/datasets/master/earthquakes-23k.csv')df_global= pd.concat([pd.read_csv('00_05.csv'),pd.read_csv('05_10.csv'),pd.read_csv('10_15.csv'),pd.read_csv('15_20.csv')]).iloc[:,[0,1,2,4]].rename(columns={'latitude':'Latitude','longitude':'Longitude','mag':'Magnitude'}).reset_index().iloc[:,1:]df_global = df_global.assign(Year=list(map(lambda x: x.split('-')[0], df_global.time))).iloc[:,1:]df_global.Year = df_global.Year.astype(np.float64)class MooYaHo:
def __init__(self,df):
self.df = df
self.f = df.Magnitude.to_numpy()
self.year = df.Year.to_numpy()
self.lat = df.Latitude.to_numpy()
self.long = df.Longitude.to_numpy()
self.n = len(self.f)
self.theta= None
def get_distance(self):
self.D = np.zeros([self.n,self.n])
locations = np.stack([self.lat, self.long],axis=1)
for i in tqdm.tqdm(range(self.n)):
for j in range(i,self.n):
self.D[i,j]=haversine(locations[i],locations[j])
self.D = self.D+self.D.T
def get_weightmatrix(self,theta=1,beta=0.5,kappa=4000):
self.theta = theta
dist = np.where(self.D<kappa,self.D,0)
self.W = np.exp(-(dist/self.theta)**2)
def _eigen(self):
d= self.W.sum(axis=1)
D= np.diag(d)
self.L = np.diag(1/np.sqrt(d)) @ (D-self.W) @ np.diag(1/np.sqrt(d))
self.lamb, self.Psi = np.linalg.eigh(self.L)
self.Lamb = np.diag(self.lamb)
def fit(self,m):
self._eigen()
self.fhat = self.Psi[:,0:m]@self.Psi[:,0:m].T@self.f
self.df = self.df.assign(MagnitudeHat = self.fhat)
self.df = self.df.assign(Residual = self.df.Magnitude- self.df.MagnitudeHat)
plt.plot(self.f,'.')
plt.plot(self.fhat,'x')class MooYaHo2(MooYaHo): # ebayesthresh 기능추가
def fit2(self): # fit with ebayesthresh
self._eigen()
self.fbar = self.Psi.T @ self.f # fbar := graph fourier transform of f
self.power = self.fbar**2
ebayesthresh = importr('EbayesThresh').ebayesthresh
self.power_threshed=np.array(ebayesthresh(FloatVector(self.fbar**2)))
self.fbar_threshed = np.where(self.power_threshed>0,self.fbar,0)
self.fhat = self.Psi@self.fbar_threshed
self.df = self.df.assign(MagnitudeHat = self.fhat)
self.df = self.df.assign(Residual = self.df.Magnitude- self.df.MagnitudeHat)
self.con = np.where(self.df.Residual>0.7,1,0)class eachlocation(MooYaHo2):
def haiti(self,MagThresh=7,ResThresh=1,adjzoom=5,adjmarkersize = 40):
fig = px.density_mapbox(self.df,
lat='Latitude',
lon='Longitude',
z='Magnitude',
radius=15,
center=dict(lat=18.4430, lon=-72.5710),
zoom= adjzoom,
height=900,
opacity = 0.8,
mapbox_style="open-street-map",
range_color=[-3,3])
fig.update_layout(margin={"r":0,"t":0,"l":0,"b":0})
fig.add_scattermapbox(lat = self.df.query('Magnitude > @MagThresh')['Latitude'],
lon = self.df.query('Magnitude > @MagThresh')['Longitude'],
text = self.df.query('Magnitude > @MagThresh')['Magnitude'],
marker_size= 5,
marker_color= 'blue',
opacity = 0.1
)
fig.add_scattermapbox(lat = self.df.query('Residual**2 > @ResThresh')['Latitude'],
lon = self.df.query('Residual**2 > @ResThresh')['Longitude'],
text = self.df.query('Magnitude > @ResThresh')['Magnitude'],
marker_size= adjmarkersize,
marker_color= 'red',
opacity = 0.8
)
fig.add_trace(go.Scattermapbox(
lat=self.df.query('Residual**2 > @ResThresh')['Latitude'],
lon=self.df.query('Residual**2 > @ResThresh')['Longitude'],
mode='markers',
marker=go.scattermapbox.Marker(
size=20,
color='rgb(255, 255, 255)',
opacity=0.4
)
))
return fig
def lquique(self,MagThresh=7,ResThresh=1,adjzoom=5, adjmarkersize= 40):
fig = px.density_mapbox(self.df,
lat='Latitude',
lon='Longitude',
z='Magnitude',
radius=15,
center=dict(lat=-32.6953, lon=-71.4416),
zoom=adjzoom,
height=900,
opacity = 0.8,
mapbox_style="open-street-map",
range_color=[-7,7])
fig.update_layout(margin={"r":0,"t":0,"l":0,"b":0})
fig.add_scattermapbox(lat = self.df.query('Magnitude > @MagThresh')['Latitude'],
lon = self.df.query('Magnitude > @MagThresh')['Longitude'],
text = self.df.query('Magnitude > @MagThresh')['Magnitude'],
marker_size= 5,
marker_color= 'blue',
opacity = 0.1
)
fig.add_scattermapbox(lat = self.df.query('Residual**2 > @ResThresh')['Latitude'],
lon = self.df.query('Residual**2 > @ResThresh')['Longitude'],
text = self.df.query('Magnitude > @ResThresh')['Magnitude'],
marker_size= adjmarkersize,
marker_color= 'red',
opacity = 0.8
)
fig.add_trace(go.Scattermapbox(
lat=self.df.query('Residual**2 > @ResThresh')['Latitude'],
lon=self.df.query('Residual**2 > @ResThresh')['Longitude'],
mode='markers',
marker=go.scattermapbox.Marker(
size=20,
color='rgb(255, 255, 255)',
opacity=0.8
)
))
return fig
def sichuan(self,MagThresh=7,ResThresh=1,adjzoom=5,adjmarkersize=40):
fig = px.density_mapbox(self.df,
lat='Latitude',
lon='Longitude',
z='Magnitude',
radius=15,
center=dict(lat=30.3080, lon=102.8880),
zoom=adjzoom,
height=900,
opacity = 0.6,
mapbox_style="open-street-map",
range_color=[-7,7])
fig.update_layout(margin={"r":0,"t":0,"l":0,"b":0})
fig.add_scattermapbox(lat = self.df.query('Magnitude > @MagThresh')['Latitude'],
lon = self.df.query('Magnitude > @MagThresh')['Longitude'],
text = self.df.query('Magnitude > @MagThresh')['Magnitude'],
marker_size= 5,
marker_color= 'blue',
opacity = 0.1
)
fig.add_scattermapbox(lat = self.df.query('Residual**2 > @ResThresh')['Latitude'],
lon = self.df.query('Residual**2 > @ResThresh')['Longitude'],
text = self.df.query('Magnitude > @ResThresh')['Magnitude'],
marker_size= adjmarkersize,
marker_color= 'red',
opacity = 0.8
)
fig.add_trace(go.Scattermapbox(
lat=self.df.query('Residual**2 > @ResThresh')['Latitude'],
lon=self.df.query('Residual**2 > @ResThresh')['Longitude'],
mode='markers',
marker=go.scattermapbox.Marker(
size=20,
color='rgb(255, 255, 255)',
opacity=0.8
)
))
return fig each_location=eachlocation(df_global.query("2010 <= Year < 2015"))- get distance
each_location.get_distance()100%|██████████| 12498/12498 [03:22<00:00, 61.58it/s] each_location.D[each_location.D>0].mean()8810.865423093777plt.hist(each_location.D[each_location.D>0])(array([14176290., 16005894., 21186674., 22331128., 19394182., 17548252.,
16668048., 13316436., 12973260., 2582550.]),
array([8.97930163e-02, 2.00141141e+03, 4.00273303e+03, 6.00405465e+03,
8.00537626e+03, 1.00066979e+04, 1.20080195e+04, 1.40093411e+04,
1.60106627e+04, 1.80119844e+04, 2.00133060e+04]),
<BarContainer object of 10 artists>)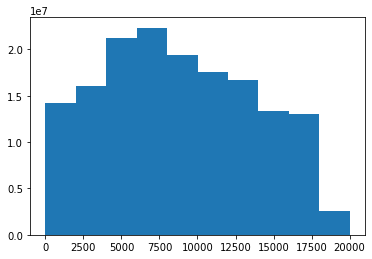
- weight matrix
each_location.get_weightmatrix(theta=(8810.865423093777),kappa=2500) - fit
each_location.fit2()each_location.haiti(MagThresh=6.9,ResThresh=0.5,adjzoom=5,adjmarkersize=40)
fig = each_location.haiti(MagThresh=6.9,ResThresh=0.5,adjzoom=5,adjmarkersize=50)
with open('earth_haiti.pkl', 'wb') as file:
pickle.dump(fig, file)
with open('earth_haiti.pkl', 'rb') as file:
earth_haiti = pickle.load(file)
earth_haiti.show()each_location.lquique(MagThresh=6.4,ResThresh=0.4,adjzoom=5,adjmarkersize=40)
fig = each_location.lquique(MagThresh=6.4,ResThresh=0.4,adjzoom=5,adjmarkersize=50)
with open('earth_lquique.pkl', 'wb') as file:
pickle.dump(fig, file)
with open('earth_lquique.pkl', 'rb') as file:
earth_lquique = pickle.load(file)
earth_lquique.show()each_location.sichuan(MagThresh=6.5,ResThresh=0.4,adjzoom=5,adjmarkersize=40)
fig = each_location.sichuan(MagThresh=6.5,ResThresh=0.4,adjzoom=5,adjmarkersize=50)
with open('earth_sichuan.pkl', 'wb') as file:
pickle.dump(fig, file)
with open('earth_sichuan.pkl', 'rb') as file:
earth_sichuan = pickle.load(file)
earth_sichuan.show()