import torch
from torch_geometric_temporal.signal import temporal_signal_splittemporal_signal_split 확인
import matplotlib.pyplot as pltimport pandas as pdfrom torch_geometric_temporal.dataset import WikiMathsDatasetLoader
dataset = WikiMathsDatasetLoader().get_dataset()
train_dataset, test_dataset = temporal_signal_split(dataset, train_ratio=0.8)dataset.snapshot_count723train_dataset.snapshot_count578test_dataset.snapshot_count145dataset.features[0].shape(1068, 8)train_dataset.features[0].shape(1068, 8)test_dataset.features[0].shape(1068, 8)mean_cases = [snapshot.y.mean().item() for snapshot in dataset]
std_cases = [snapshot.y.std().item() for snapshot in dataset]
df = pd.DataFrame(mean_cases, columns=['mean'])
df['std'] = pd.DataFrame(std_cases, columns=['std'])
plt.figure(figsize=(10,5))
plt.plot(df['mean'], 'k-', label='Mean')
plt.grid(linestyle=':')
plt.fill_between(df.index, df['mean']-df['std'], df['mean']+df['std'], color='r', alpha=0.1)
plt.axvline(x=578, color='b', linestyle='--')
plt.text(578, 1.5, 'Train/test split', rotation=-90, color='b')
plt.xlabel('Time (days)')
plt.ylabel('Normalized number of visits')
plt.legend(loc='upper right')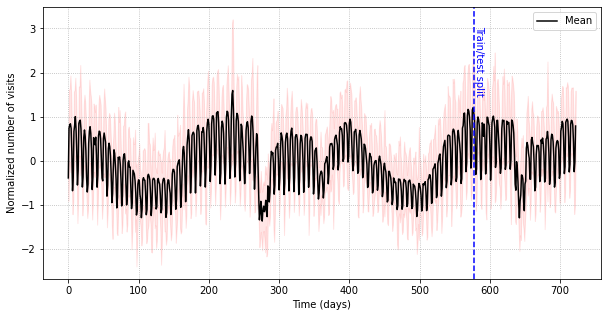
mean_cases = [snapshot.y.mean().item() for snapshot in train_dataset]
std_cases = [snapshot.y.std().item() for snapshot in train_dataset]
df = pd.DataFrame(mean_cases, columns=['mean'])
df['std'] = pd.DataFrame(std_cases, columns=['std'])
plt.figure(figsize=(10,5))
plt.plot(df['mean'], 'k-', label='Mean')
plt.grid(linestyle=':')
plt.fill_between(df.index, df['mean']-df['std'], df['mean']+df['std'], color='r', alpha=0.1)
plt.axvline(x=578, color='b', linestyle='--')
# plt.text(360, 1.5, 'Train/test split', rotation=-90, color='b')
plt.xlabel('Time (days)')
plt.ylabel('Normalized number of visits')
plt.legend(loc='upper right')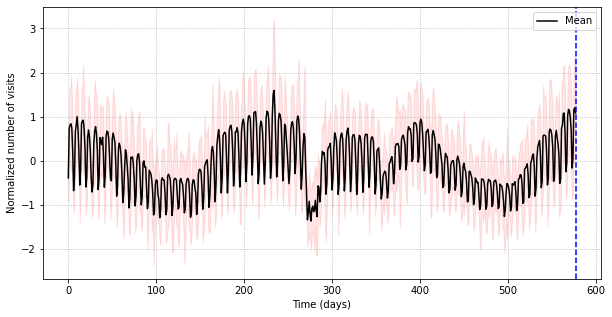
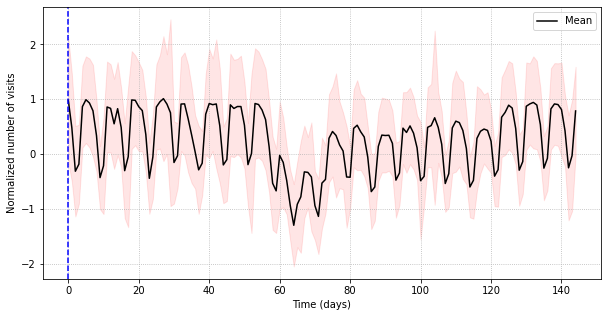
mean_cases = [snapshot.y.mean().item() for snapshot in test_dataset]
std_cases = [snapshot.y.std().item() for snapshot in test_dataset]
df = pd.DataFrame(mean_cases, columns=['mean'])
df['std'] = pd.DataFrame(std_cases, columns=['std'])

plt.figure(figsize=(10,5))
plt.plot(df['mean'], 'k-', label='Mean')
plt.grid(linestyle=':')
plt.fill_between(df.index, df['mean']-df['std'], df['mean']+df['std'], color='r', alpha=0.1)
plt.axvline(x=0, color='b', linestyle='--')
# plt.text(360, 1.5, 'Train/test split', rotation=-90, color='b')
plt.xlabel('Time (days)')
plt.ylabel('Normalized number of visits')
plt.legend(loc='upper right')