import pandas as pd1
df_med = pd.read_csv("../../../delete/1000 Generic Medication Names_NHC.txt", delimiter='\t',header=None)
df_med| 0 | |
|---|---|
| 0 | 1. Acetaminophen Tablet (500 mg) - Analgesic |
| 1 | 2. Ibuprofen Tablet (200 mg) - Nonsteroidal An... |
| 2 | 3. Aspirin Tablet (81 mg) - Platelet Aggregati... |
| 3 | 4. Naproxen Tablet (250 mg) - Nonsteroidal Ant... |
| 4 | 5. Morphine Tablet (15 mg) - Opioid Analgesic |
| ... | ... |
| 995 | 996. Alprostadil Urethral Suppository (250 mcg... |
| 996 | 997. Phentolamine Injection (1 mg/mL) - Alpha-... |
| 997 | 998. Papaverine Injection (30 mg/mL) - Vasodil... |
| 998 | 999. Yohimbine Tablet (5.4 mg) - Alpha-2 Blocker |
| 999 | 1000. L-Arginine Tablet (500 mg) - Amino Acid ... |
1000 rows × 1 columns
텍스트가 탭
\t으로 나누어져 있기 때문에 구분자를 넣어서delimiter='\t'데이터를 불러와줘야 한다!
df_med[0][0]'1. Acetaminophen Tablet (500 mg) - Analgesic'데이터를 나눠줘야 할 것으로 보인다.
type(df_med[0][0])str데이터 타입은 str 문자열, string
df_med[0][0].split(".")['1', ' Acetaminophen Tablet (500 mg) - Analgesic']구분자를 .으로 해서 나눠주면 1.이랑 분리됌
df_med[0][0].split("-")['1. Acetaminophen Tablet (500 mg) ', ' Analgesic']구분자를 -으로 해서 나눠주면 앞 뒤로 구분됌
type(df_med[0][0].split("-"))list구분자 split써서 나눠주면 데이터 타입은 리스트로 처리된다.
df_med[0][0].split("-")[0]'1. Acetaminophen Tablet (500 mg) 'df_med[0][0].split("-")[1]' Analgesic'구분자 -를 기준으로 앞 뒤로 보면 위와 같다.
df_med['Med_class'] = df_med[0].apply(lambda x : x.split("-")[1])
df_med| 0 | Med_class | |
|---|---|---|
| 0 | 1. Acetaminophen Tablet (500 mg) - Analgesic | Analgesic |
| 1 | 2. Ibuprofen Tablet (200 mg) - Nonsteroidal An... | Nonsteroidal Anti |
| 2 | 3. Aspirin Tablet (81 mg) - Platelet Aggregati... | Platelet Aggregation Inhibitor |
| 3 | 4. Naproxen Tablet (250 mg) - Nonsteroidal Ant... | Nonsteroidal Anti |
| 4 | 5. Morphine Tablet (15 mg) - Opioid Analgesic | Opioid Analgesic |
| ... | ... | ... |
| 995 | 996. Alprostadil Urethral Suppository (250 mcg... | Prostaglandin E1 Analog |
| 996 | 997. Phentolamine Injection (1 mg/mL) - Alpha-... | Alpha |
| 997 | 998. Papaverine Injection (30 mg/mL) - Vasodil... | Vasodilator |
| 998 | 999. Yohimbine Tablet (5.4 mg) - Alpha-2 Blocker | Alpha |
| 999 | 1000. L-Arginine Tablet (500 mg) - Amino Acid ... | Arginine Tablet (500 mg) |
1000 rows × 2 columns
lambda함수를 써서 구분자-로 나눈 뒷 결과를 따로 변수 만들어준다.
df_med[0][996]'997. Phentolamine Injection (1 mg/mL) - Alpha-Blocker'위처럼 구분자-가 두 개 있는 데이터도 있을 수 있음. 결론 잘 살펴봐야 함
df_med['Med_class'][996]' Alpha'그래서 새로 만든 변수가 이상하게 만들어진 겻을 볼 수 있음
df_med[0][998]'999. Yohimbine Tablet (5.4 mg) - Alpha-2 Blocker'df_med[0][999]'1000. L-Arginine Tablet (500 mg) - Amino Acid Supplement'df_med[0][999].split(".")['1000', ' L-Arginine Tablet (500 mg) - Amino Acid Supplement']df_med[0][999].split(".")[1]' L-Arginine Tablet (500 mg) - Amino Acid Supplement'df_med[0][999].split(".")[1].split("-")[' L', 'Arginine Tablet (500 mg) ', ' Amino Acid Supplement']df_med[0][999].split(".")[1].split("-")[0]' L'df_med[0][998].split(".")['999', ' Yohimbine Tablet (5', '4 mg) - Alpha-2 Blocker']df_med[0][998].split(".",maxsplit=1)['999', ' Yohimbine Tablet (5.4 mg) - Alpha-2 Blocker']해결법 split을 무한히 하지 않게 maxsplit 으로 최대 구분 수를 지정해준다.
df_med["Med_name"] = df_med[0].apply(lambda x: x.split(".", maxsplit=1)[1].split("-")[0])
df_med| 0 | Med_class | Med_name | |
|---|---|---|---|
| 0 | 1. Acetaminophen Tablet (500 mg) - Analgesic | Analgesic | Acetaminophen Tablet (500 mg) |
| 1 | 2. Ibuprofen Tablet (200 mg) - Nonsteroidal An... | Nonsteroidal Anti | Ibuprofen Tablet (200 mg) |
| 2 | 3. Aspirin Tablet (81 mg) - Platelet Aggregati... | Platelet Aggregation Inhibitor | Aspirin Tablet (81 mg) |
| 3 | 4. Naproxen Tablet (250 mg) - Nonsteroidal Ant... | Nonsteroidal Anti | Naproxen Tablet (250 mg) |
| 4 | 5. Morphine Tablet (15 mg) - Opioid Analgesic | Opioid Analgesic | Morphine Tablet (15 mg) |
| ... | ... | ... | ... |
| 995 | 996. Alprostadil Urethral Suppository (250 mcg... | Prostaglandin E1 Analog | Alprostadil Urethral Suppository (250 mcg) |
| 996 | 997. Phentolamine Injection (1 mg/mL) - Alpha-... | Alpha | Phentolamine Injection (1 mg/mL) |
| 997 | 998. Papaverine Injection (30 mg/mL) - Vasodil... | Vasodilator | Papaverine Injection (30 mg/mL) |
| 998 | 999. Yohimbine Tablet (5.4 mg) - Alpha-2 Blocker | Alpha | Yohimbine Tablet (5.4 mg) |
| 999 | 1000. L-Arginine Tablet (500 mg) - Amino Acid ... | Arginine Tablet (500 mg) | L |
1000 rows × 3 columns
import pandas as pddf_visit = pd.read_csv("../../../delete/Demo Patient Experience Data_NHC.csv")
df_visit| Unnamed: 0 | Entry Code | Feedback Date | Patient Age | Staff Rating | Speed Rating | Wait Time (minutes) | Test Type | Review | |
|---|---|---|---|---|---|---|---|---|---|
| 0 | 0 | 1 | 2022-10-22 | 61 | 5 | 3 | 29 | Urine Test | I couldn't have asked for better service from ... |
| 1 | 1 | 2 | 2022-01-12 | 26 | 3 | 4 | 171 | Biopsy | I'm indifferent about the service provided by ... |
| 2 | 2 | 3 | 2022-04-06 | 53 | 3 | 5 | 176 | Urine Test | My experience with the staff was neither good ... |
| 3 | 3 | 4 | 2022-12-11 | 40 | 4 | 5 | 94 | CT Scan | I might consider returning for future tests, b... |
| 4 | 4 | 5 | 2022-10-31 | 96 | 2 | 1 | 165 | Biopsy | The service was poor, there are serious improv... |
| ... | ... | ... | ... | ... | ... | ... | ... | ... | ... |
| 19995 | 19995 | 19996 | 2022-09-01 | 34 | 3 | 2 | 128 | CT Scan | It was okay, the staff's performance was nothi... |
| 19996 | 19996 | 19997 | 2022-05-26 | 80 | 2 | 4 | 84 | Blood Test | I was quite disappointed, and there is a lot o... |
| 19997 | 19997 | 19998 | 2022-11-01 | 60 | 2 | 1 | 76 | Ultrasound | I was quite disappointed, and there is a lot o... |
| 19998 | 19998 | 19999 | 2022-10-09 | 62 | 1 | 5 | 16 | Biopsy | There are no redeeming qualities about the ser... |
| 19999 | 19999 | 20000 | 2022-02-16 | 13 | 5 | 1 | 86 | Ultrasound | The staff's expertise and dedication made my v... |
20000 rows × 9 columns
df_visit.info()<class 'pandas.core.frame.DataFrame'>
RangeIndex: 20000 entries, 0 to 19999
Data columns (total 9 columns):
# Column Non-Null Count Dtype
--- ------ -------------- -----
0 Unnamed: 0 20000 non-null int64
1 Entry Code 20000 non-null int64
2 Feedback Date 20000 non-null object
3 Patient Age 20000 non-null int64
4 Staff Rating 20000 non-null int64
5 Speed Rating 20000 non-null int64
6 Wait Time (minutes) 20000 non-null int64
7 Test Type 20000 non-null object
8 Review 20000 non-null object
dtypes: int64(6), object(3)
memory usage: 1.4+ MBdf_visit.isna()| Unnamed: 0 | Entry Code | Feedback Date | Patient Age | Staff Rating | Speed Rating | Wait Time (minutes) | Test Type | Review | |
|---|---|---|---|---|---|---|---|---|---|
| 0 | False | False | False | False | False | False | False | False | False |
| 1 | False | False | False | False | False | False | False | False | False |
| 2 | False | False | False | False | False | False | False | False | False |
| 3 | False | False | False | False | False | False | False | False | False |
| 4 | False | False | False | False | False | False | False | False | False |
| ... | ... | ... | ... | ... | ... | ... | ... | ... | ... |
| 19995 | False | False | False | False | False | False | False | False | False |
| 19996 | False | False | False | False | False | False | False | False | False |
| 19997 | False | False | False | False | False | False | False | False | False |
| 19998 | False | False | False | False | False | False | False | False | False |
| 19999 | False | False | False | False | False | False | False | False | False |
20000 rows × 9 columns
결측값 확인
df_visit.isna().sum()Unnamed: 0 0
Entry Code 0
Feedback Date 0
Patient Age 0
Staff Rating 0
Speed Rating 0
Wait Time (minutes) 0
Test Type 0
Review 0
dtype: int64결측값 갯수 확인
df_visit.dropna()| Unnamed: 0 | Entry Code | Feedback Date | Patient Age | Staff Rating | Speed Rating | Wait Time (minutes) | Test Type | Review | |
|---|---|---|---|---|---|---|---|---|---|
| 0 | 0 | 1 | 2022-10-22 | 61 | 5 | 3 | 29 | Urine Test | I couldn't have asked for better service from ... |
| 1 | 1 | 2 | 2022-01-12 | 26 | 3 | 4 | 171 | Biopsy | I'm indifferent about the service provided by ... |
| 2 | 2 | 3 | 2022-04-06 | 53 | 3 | 5 | 176 | Urine Test | My experience with the staff was neither good ... |
| 3 | 3 | 4 | 2022-12-11 | 40 | 4 | 5 | 94 | CT Scan | I might consider returning for future tests, b... |
| 4 | 4 | 5 | 2022-10-31 | 96 | 2 | 1 | 165 | Biopsy | The service was poor, there are serious improv... |
| ... | ... | ... | ... | ... | ... | ... | ... | ... | ... |
| 19995 | 19995 | 19996 | 2022-09-01 | 34 | 3 | 2 | 128 | CT Scan | It was okay, the staff's performance was nothi... |
| 19996 | 19996 | 19997 | 2022-05-26 | 80 | 2 | 4 | 84 | Blood Test | I was quite disappointed, and there is a lot o... |
| 19997 | 19997 | 19998 | 2022-11-01 | 60 | 2 | 1 | 76 | Ultrasound | I was quite disappointed, and there is a lot o... |
| 19998 | 19998 | 19999 | 2022-10-09 | 62 | 1 | 5 | 16 | Biopsy | There are no redeeming qualities about the ser... |
| 19999 | 19999 | 20000 | 2022-02-16 | 13 | 5 | 1 | 86 | Ultrasound | The staff's expertise and dedication made my v... |
20000 rows × 9 columns
결측값 제거
근데 dropna 함부로 쓰면 안 됌..
df_visit = df_visit.dropna()
df_visit| Unnamed: 0 | Entry Code | Feedback Date | Patient Age | Staff Rating | Speed Rating | Wait Time (minutes) | Test Type | Review | |
|---|---|---|---|---|---|---|---|---|---|
| 0 | 0 | 1 | 2022-10-22 | 61 | 5 | 3 | 29 | Urine Test | I couldn't have asked for better service from ... |
| 1 | 1 | 2 | 2022-01-12 | 26 | 3 | 4 | 171 | Biopsy | I'm indifferent about the service provided by ... |
| 2 | 2 | 3 | 2022-04-06 | 53 | 3 | 5 | 176 | Urine Test | My experience with the staff was neither good ... |
| 3 | 3 | 4 | 2022-12-11 | 40 | 4 | 5 | 94 | CT Scan | I might consider returning for future tests, b... |
| 4 | 4 | 5 | 2022-10-31 | 96 | 2 | 1 | 165 | Biopsy | The service was poor, there are serious improv... |
| ... | ... | ... | ... | ... | ... | ... | ... | ... | ... |
| 19995 | 19995 | 19996 | 2022-09-01 | 34 | 3 | 2 | 128 | CT Scan | It was okay, the staff's performance was nothi... |
| 19996 | 19996 | 19997 | 2022-05-26 | 80 | 2 | 4 | 84 | Blood Test | I was quite disappointed, and there is a lot o... |
| 19997 | 19997 | 19998 | 2022-11-01 | 60 | 2 | 1 | 76 | Ultrasound | I was quite disappointed, and there is a lot o... |
| 19998 | 19998 | 19999 | 2022-10-09 | 62 | 1 | 5 | 16 | Biopsy | There are no redeeming qualities about the ser... |
| 19999 | 19999 | 20000 | 2022-02-16 | 13 | 5 | 1 | 86 | Ultrasound | The staff's expertise and dedication made my v... |
20000 rows × 9 columns
df_visit.head()| Unnamed: 0 | Entry Code | Feedback Date | Patient Age | Staff Rating | Speed Rating | Wait Time (minutes) | Test Type | Review | |
|---|---|---|---|---|---|---|---|---|---|
| 0 | 0 | 1 | 2022-10-22 | 61 | 5 | 3 | 29 | Urine Test | I couldn't have asked for better service from ... |
| 1 | 1 | 2 | 2022-01-12 | 26 | 3 | 4 | 171 | Biopsy | I'm indifferent about the service provided by ... |
| 2 | 2 | 3 | 2022-04-06 | 53 | 3 | 5 | 176 | Urine Test | My experience with the staff was neither good ... |
| 3 | 3 | 4 | 2022-12-11 | 40 | 4 | 5 | 94 | CT Scan | I might consider returning for future tests, b... |
| 4 | 4 | 5 | 2022-10-31 | 96 | 2 | 1 | 165 | Biopsy | The service was poor, there are serious improv... |
df_visit.head(20)| Unnamed: 0 | Entry Code | Feedback Date | Patient Age | Staff Rating | Speed Rating | Wait Time (minutes) | Test Type | Review | |
|---|---|---|---|---|---|---|---|---|---|
| 0 | 0 | 1 | 2022-10-22 | 61 | 5 | 3 | 29 | Urine Test | I couldn't have asked for better service from ... |
| 1 | 1 | 2 | 2022-01-12 | 26 | 3 | 4 | 171 | Biopsy | I'm indifferent about the service provided by ... |
| 2 | 2 | 3 | 2022-04-06 | 53 | 3 | 5 | 176 | Urine Test | My experience with the staff was neither good ... |
| 3 | 3 | 4 | 2022-12-11 | 40 | 4 | 5 | 94 | CT Scan | I might consider returning for future tests, b... |
| 4 | 4 | 5 | 2022-10-31 | 96 | 2 | 1 | 165 | Biopsy | The service was poor, there are serious improv... |
| 5 | 5 | 6 | 2022-01-20 | 37 | 1 | 1 | 13 | CT Scan | The service was abysmal, and I'm extremely uns... |
| 6 | 6 | 7 | 2022-10-06 | 46 | 1 | 1 | 12 | X-ray | The service was abysmal, and I'm extremely uns... |
| 7 | 7 | 8 | 2022-03-10 | 55 | 5 | 4 | 167 | MRI | I couldn't have asked for better service from ... |
| 8 | 8 | 9 | 2022-11-14 | 19 | 5 | 5 | 125 | CT Scan | The staff was outstanding, I couldn't be happi... |
| 9 | 9 | 10 | 2022-01-28 | 84 | 2 | 1 | 125 | Urine Test | I had a below-average experience, with several... |
| 10 | 10 | 11 | 2022-06-25 | 35 | 2 | 1 | 174 | MRI | I had a below-average experience, with several... |
| 11 | 11 | 12 | 2022-08-04 | 36 | 1 | 2 | 100 | CT Scan | I had a nightmarish experience, and I'm highly... |
| 12 | 12 | 13 | 2022-10-28 | 84 | 4 | 4 | 167 | Biopsy | A good but not great experience with the staff... |
| 13 | 13 | 14 | 2022-04-07 | 67 | 2 | 1 | 64 | Blood Test | I was quite disappointed, and there is a lot o... |
| 14 | 14 | 15 | 2022-03-03 | 27 | 2 | 5 | 92 | X-ray | I was quite disappointed, and there is a lot o... |
| 15 | 15 | 16 | 2022-08-12 | 90 | 1 | 3 | 91 | CT Scan | I'll never return to this lab, and I'm sharing... |
| 16 | 16 | 17 | 2022-02-26 | 65 | 5 | 2 | 161 | Ultrasound | I'm very impressed with the quality of service... |
| 17 | 17 | 18 | 2022-03-06 | 38 | 3 | 4 | 65 | Ultrasound | The staff's service fell in the middle ground;... |
| 18 | 18 | 19 | 2022-06-26 | 66 | 2 | 1 | 15 | Blood Test | A disappointing experience, with many areas re... |
| 19 | 19 | 20 | 2022-11-22 | 39 | 1 | 2 | 130 | Ultrasound | The service was abysmal, and I'm extremely uns... |
df_visit.rename(columns={'Registration': 'Registration_minutes'})| Unnamed: 0 | Entry Code | Feedback Date | Patient Age | Staff Rating | Speed Rating | Wait Time (minutes) | Test Type | Review | |
|---|---|---|---|---|---|---|---|---|---|
| 0 | 0 | 1 | 2022-10-22 | 61 | 5 | 3 | 29 | Urine Test | I couldn't have asked for better service from ... |
| 1 | 1 | 2 | 2022-01-12 | 26 | 3 | 4 | 171 | Biopsy | I'm indifferent about the service provided by ... |
| 2 | 2 | 3 | 2022-04-06 | 53 | 3 | 5 | 176 | Urine Test | My experience with the staff was neither good ... |
| 3 | 3 | 4 | 2022-12-11 | 40 | 4 | 5 | 94 | CT Scan | I might consider returning for future tests, b... |
| 4 | 4 | 5 | 2022-10-31 | 96 | 2 | 1 | 165 | Biopsy | The service was poor, there are serious improv... |
| ... | ... | ... | ... | ... | ... | ... | ... | ... | ... |
| 19995 | 19995 | 19996 | 2022-09-01 | 34 | 3 | 2 | 128 | CT Scan | It was okay, the staff's performance was nothi... |
| 19996 | 19996 | 19997 | 2022-05-26 | 80 | 2 | 4 | 84 | Blood Test | I was quite disappointed, and there is a lot o... |
| 19997 | 19997 | 19998 | 2022-11-01 | 60 | 2 | 1 | 76 | Ultrasound | I was quite disappointed, and there is a lot o... |
| 19998 | 19998 | 19999 | 2022-10-09 | 62 | 1 | 5 | 16 | Biopsy | There are no redeeming qualities about the ser... |
| 19999 | 19999 | 20000 | 2022-02-16 | 13 | 5 | 1 | 86 | Ultrasound | The staff's expertise and dedication made my v... |
20000 rows × 9 columns
열 이름 변경
df_visit.head()| Unnamed: 0 | Entry Code | Feedback Date | Patient Age | Staff Rating | Speed Rating | Wait Time (minutes) | Test Type | Review | |
|---|---|---|---|---|---|---|---|---|---|
| 0 | 0 | 1 | 2022-10-22 | 61 | 5 | 3 | 29 | Urine Test | I couldn't have asked for better service from ... |
| 1 | 1 | 2 | 2022-01-12 | 26 | 3 | 4 | 171 | Biopsy | I'm indifferent about the service provided by ... |
| 2 | 2 | 3 | 2022-04-06 | 53 | 3 | 5 | 176 | Urine Test | My experience with the staff was neither good ... |
| 3 | 3 | 4 | 2022-12-11 | 40 | 4 | 5 | 94 | CT Scan | I might consider returning for future tests, b... |
| 4 | 4 | 5 | 2022-10-31 | 96 | 2 | 1 | 165 | Biopsy | The service was poor, there are serious improv... |
df_visit.rename(columns={'Registration': 'Registration_minutes'},inplace=True)inplce로 원본인 df_visit 자체를 변경할 수 있는데
원본 데이터를 건드는 것이기 때문에 신중히 처리할 것
df_visit.head()| Visit_Date | Patient_ID | Age | Gender | Diagnosis | Has_Insurance | Postcode | Total_Cost | Registration_minutes | Nursing | Laboratory | Consultation | Pharmacy | |
|---|---|---|---|---|---|---|---|---|---|---|---|---|---|
| 0 | 2020-05-06 | 688923 | 68 | Female | Diabetes | True | 20006 | 2274.0 | 33 | 105 | 101 | 28 | 112 |
| 1 | 2018-08-04 | 886361 | 62 | Female | Urinary Tract Infection | False | 20005 | 3430.0 | 46 | 75 | 84 | 102 | 36 |
| 2 | 2021-04-10 | 464823 | 70 | Female | Upper Respiratory Tract Infection | True | 10003 | 1836.0 | 107 | 81 | 5 | 77 | 36 |
| 3 | 2021-10-01 | 655214 | 8 | Female | Upper Respiratory Tract Infection | False | 10006 | 3250.0 | 66 | 31 | 101 | 35 | 92 |
| 4 | 2018-04-30 | 454666 | 24 | Male | Malaria | True | 10006 | 2262.0 | 68 | 55 | 60 | 90 | 104 |
column_mapping = {'Nursing':'Nursing_minutes','Laboratory': 'Laboratory_minutes','Consultation':'Consulation_minutes','Pharmacy': 'Pharmacy_minutes'}df_visit.rename(columns=column_mapping,inplace=True)
df_visit| Visit_Date | Patient_ID | Age | Gender | Diagnosis | Has_Insurance | Postcode | Total_Cost | Registration_minutes | Nursing_minutes | Laboratory_minutes | Consulation_minutes | Pharmacy_minutes | |
|---|---|---|---|---|---|---|---|---|---|---|---|---|---|
| 0 | 2020-05-06 | 688923 | 68 | Female | Diabetes | True | 20006 | 2274.0 | 33 | 105 | 101 | 28 | 112 |
| 1 | 2018-08-04 | 886361 | 62 | Female | Urinary Tract Infection | False | 20005 | 3430.0 | 46 | 75 | 84 | 102 | 36 |
| 2 | 2021-04-10 | 464823 | 70 | Female | Upper Respiratory Tract Infection | True | 10003 | 1836.0 | 107 | 81 | 5 | 77 | 36 |
| 3 | 2021-10-01 | 655214 | 8 | Female | Upper Respiratory Tract Infection | False | 10006 | 3250.0 | 66 | 31 | 101 | 35 | 92 |
| 4 | 2018-04-30 | 454666 | 24 | Male | Malaria | True | 10006 | 2262.0 | 68 | 55 | 60 | 90 | 104 |
| ... | ... | ... | ... | ... | ... | ... | ... | ... | ... | ... | ... | ... | ... |
| 999995 | 2018-09-30 | 385435 | 9 | Male | Abdominal pain | True | 10004 | 1458.0 | 80 | 52 | 11 | 42 | 58 |
| 999996 | 2020-05-08 | 117261 | 29 | Female | Urinary Tract Infection | True | 20009 | 1836.0 | 59 | 57 | 64 | 66 | 60 |
| 999997 | 2019-12-31 | 594613 | 39 | Female | Upper Respiratory Tract Infection | False | 10001 | 1930.0 | 10 | 14 | 69 | 14 | 86 |
| 999998 | 2019-11-04 | 152179 | 39 | Female | Malaria | False | 20006 | 3950.0 | 119 | 52 | 60 | 94 | 70 |
| 999999 | 2019-05-11 | 370584 | 76 | Female | Malaria | False | 20012 | 3500.0 | 34 | 90 | 29 | 97 | 100 |
1000000 rows × 13 columns
2
import pandas as pd
import matplotlib.pyplot as plt
df_visit = pd.read_csv('../../../delete/Demo Hospital Outpatient Data Clean_NHC.csv')
df_visit| Visit_Date | Patient_ID | Age | Gender | Diagnosis | Has_Insurance | Postcode | Total_Cost | Registration(minutes) | Nursing(minutes) | Laboratory(minutes) | Consultation(minutes) | Pharmacy(minutes) | |
|---|---|---|---|---|---|---|---|---|---|---|---|---|---|
| 0 | 2020-05-06 | 688923 | 68 | Female | Diabetes | True | 20006 | 2274.0 | 33.0 | 105.0 | 101.0 | 28.0 | 112.0 |
| 1 | 2018-08-04 | 886361 | 62 | Female | Urinary Tract Infection | False | 20005 | 3430.0 | 46.0 | 75.0 | 84.0 | 102.0 | 36.0 |
| 2 | 2021-04-10 | 464823 | 70 | Female | Upper Respiratory Tract Infection | True | 10003 | 1836.0 | 107.0 | 81.0 | 5.0 | 77.0 | 36.0 |
| 3 | 2021-10-01 | 655214 | 8 | Female | Upper Respiratory Tract Infection | False | 10006 | 3250.0 | 66.0 | 31.0 | 101.0 | 35.0 | 92.0 |
| 4 | 2018-04-30 | 454666 | 24 | Male | Malaria | True | 10006 | 2262.0 | 68.0 | 55.0 | 60.0 | 90.0 | 104.0 |
| ... | ... | ... | ... | ... | ... | ... | ... | ... | ... | ... | ... | ... | ... |
| 68617 | 2020-06-22 | 668182 | 10 | Female | Abdominal pain | True | 10006 | 2718.0 | 90.0 | 96.0 | 62.0 | 92.0 | 113.0 |
| 68618 | 2020-09-03 | 484737 | 7 | Male | Abdominal pain | True | 10009 | 2028.0 | 101.0 | 76.0 | 110.0 | 37.0 | 14.0 |
| 68619 | 2021-06-16 | 917198 | 22 | Female | Urinary Tract Infection | True | 20008 | 1212.0 | 66.0 | 80.0 | 15.0 | 36.0 | 5.0 |
| 68620 | 2021-09-15 | 98720 | 22 | Female | Malaria | True | 20006 | 1668.0 | 9.0 | 36.0 | 107.0 | 87.0 | 39.0 |
| 68621 | 2019-12-15 | 251371 | 5 | Male | Malaria | False | 10014 | 1850.0 | 18.0 | 74.0 | 42.0 | 44.0 | 7.0 |
68622 rows × 13 columns
df_visit['Gender'].value_counts()Female 34454
Male 34168
Name: Gender, dtype: int64여자 남자 비율
visit_gender = df_visit['Gender'].value_counts()visit_gender.plot()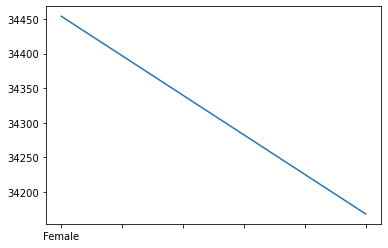
visit_gender.plot(kind='bar')
plt.title("Visit Gender Distribution");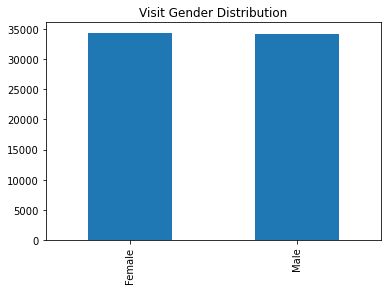
visit_gender.plot(kind='bar',color=['skyblue','pink'])
plt.title("Visit Gender Distribution");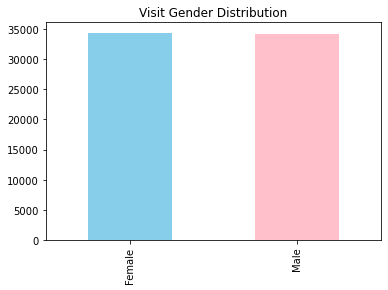
visit_gender.plot(kind='bar',color=['blue','pink'])
plt.title("Visit Gender Distribution");
plt.xlabel('Gender')
plt.ylabel('Count');
# plt.show()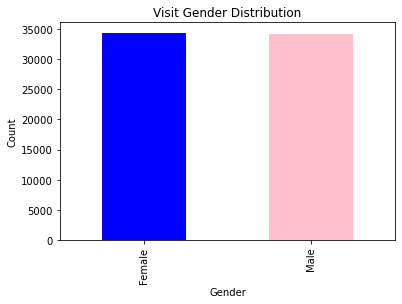
주석 보기 싫으면 plt.show()쓰면 되긴 하는데 ; 써도 되긴 함
plt.hist(df_visit['Age'],bins=20,color='purple',edgecolor='b')
plt.title('Age Distribution');
# plt.show()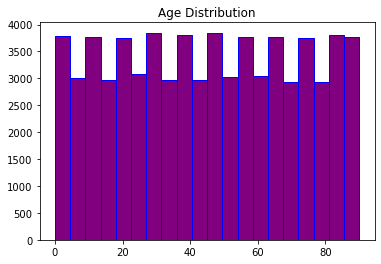
df_visit = pd.read_csv('../../../delete/Demo Hospital Outpatient Data Clean_NHC.csv')
df_visit| Visit_Date | Patient_ID | Age | Gender | Diagnosis | Has_Insurance | Postcode | Total_Cost | Registration(minutes) | Nursing(minutes) | Laboratory(minutes) | Consultation(minutes) | Pharmacy(minutes) | |
|---|---|---|---|---|---|---|---|---|---|---|---|---|---|
| 0 | 2020-05-06 | 688923 | 68 | Female | Diabetes | True | 20006 | 2274.0 | 33.0 | 105.0 | 101.0 | 28.0 | 112.0 |
| 1 | 2018-08-04 | 886361 | 62 | Female | Urinary Tract Infection | False | 20005 | 3430.0 | 46.0 | 75.0 | 84.0 | 102.0 | 36.0 |
| 2 | 2021-04-10 | 464823 | 70 | Female | Upper Respiratory Tract Infection | True | 10003 | 1836.0 | 107.0 | 81.0 | 5.0 | 77.0 | 36.0 |
| 3 | 2021-10-01 | 655214 | 8 | Female | Upper Respiratory Tract Infection | False | 10006 | 3250.0 | 66.0 | 31.0 | 101.0 | 35.0 | 92.0 |
| 4 | 2018-04-30 | 454666 | 24 | Male | Malaria | True | 10006 | 2262.0 | 68.0 | 55.0 | 60.0 | 90.0 | 104.0 |
| ... | ... | ... | ... | ... | ... | ... | ... | ... | ... | ... | ... | ... | ... |
| 68617 | 2020-06-22 | 668182 | 10 | Female | Abdominal pain | True | 10006 | 2718.0 | 90.0 | 96.0 | 62.0 | 92.0 | 113.0 |
| 68618 | 2020-09-03 | 484737 | 7 | Male | Abdominal pain | True | 10009 | 2028.0 | 101.0 | 76.0 | 110.0 | 37.0 | 14.0 |
| 68619 | 2021-06-16 | 917198 | 22 | Female | Urinary Tract Infection | True | 20008 | 1212.0 | 66.0 | 80.0 | 15.0 | 36.0 | 5.0 |
| 68620 | 2021-09-15 | 98720 | 22 | Female | Malaria | True | 20006 | 1668.0 | 9.0 | 36.0 | 107.0 | 87.0 | 39.0 |
| 68621 | 2019-12-15 | 251371 | 5 | Male | Malaria | False | 10014 | 1850.0 | 18.0 | 74.0 | 42.0 | 44.0 | 7.0 |
68622 rows × 13 columns
df_visit['Visit_Date'][0]'2020-05-06'날짜 열 확인
type(df_visit['Visit_Date'][0])str날짜열은 문자열인 것 확인
df_visit['Visit_Date'] = pd.to_datetime(df_visit['Visit_Date'])pd.to_datetime: This function converts a scalar, array-like, :class:Series or :class:DataFrame/dict-like to a pandas datetime object.
type(df_visit['Visit_Date'][0])pandas._libs.tslibs.timestamps.Timestamp타임스탬프 내부 타입을 의미함
df_visit.set_index('Visit_Date',inplace=True)df_visit| Patient_ID | Age | Gender | Diagnosis | Has_Insurance | Postcode | Total_Cost | Registration(minutes) | Nursing(minutes) | Laboratory(minutes) | Consultation(minutes) | Pharmacy(minutes) | |
|---|---|---|---|---|---|---|---|---|---|---|---|---|
| Visit_Date | ||||||||||||
| 2020-05-06 | 688923 | 68 | Female | Diabetes | True | 20006 | 2274.0 | 33.0 | 105.0 | 101.0 | 28.0 | 112.0 |
| 2018-08-04 | 886361 | 62 | Female | Urinary Tract Infection | False | 20005 | 3430.0 | 46.0 | 75.0 | 84.0 | 102.0 | 36.0 |
| 2021-04-10 | 464823 | 70 | Female | Upper Respiratory Tract Infection | True | 10003 | 1836.0 | 107.0 | 81.0 | 5.0 | 77.0 | 36.0 |
| 2021-10-01 | 655214 | 8 | Female | Upper Respiratory Tract Infection | False | 10006 | 3250.0 | 66.0 | 31.0 | 101.0 | 35.0 | 92.0 |
| 2018-04-30 | 454666 | 24 | Male | Malaria | True | 10006 | 2262.0 | 68.0 | 55.0 | 60.0 | 90.0 | 104.0 |
| ... | ... | ... | ... | ... | ... | ... | ... | ... | ... | ... | ... | ... |
| 2020-06-22 | 668182 | 10 | Female | Abdominal pain | True | 10006 | 2718.0 | 90.0 | 96.0 | 62.0 | 92.0 | 113.0 |
| 2020-09-03 | 484737 | 7 | Male | Abdominal pain | True | 10009 | 2028.0 | 101.0 | 76.0 | 110.0 | 37.0 | 14.0 |
| 2021-06-16 | 917198 | 22 | Female | Urinary Tract Infection | True | 20008 | 1212.0 | 66.0 | 80.0 | 15.0 | 36.0 | 5.0 |
| 2021-09-15 | 98720 | 22 | Female | Malaria | True | 20006 | 1668.0 | 9.0 | 36.0 | 107.0 | 87.0 | 39.0 |
| 2019-12-15 | 251371 | 5 | Male | Malaria | False | 10014 | 1850.0 | 18.0 | 74.0 | 42.0 | 44.0 | 7.0 |
68622 rows × 12 columns
df_resampled_year = df_visit.resample("Y").count()
df_resampled_year| Patient_ID | Age | Gender | Diagnosis | Has_Insurance | Postcode | Total_Cost | Registration(minutes) | Nursing(minutes) | Laboratory(minutes) | Consultation(minutes) | Pharmacy(minutes) | |
|---|---|---|---|---|---|---|---|---|---|---|---|---|
| Visit_Date | ||||||||||||
| 2018-12-31 | 13726 | 13726 | 13726 | 13726 | 13726 | 13726 | 13726 | 13726 | 13726 | 13726 | 13726 | 13726 |
| 2019-12-31 | 14011 | 14011 | 14011 | 14011 | 14011 | 14011 | 14011 | 14011 | 14011 | 14011 | 14011 | 14011 |
| 2020-12-31 | 13790 | 13790 | 13790 | 13790 | 13790 | 13790 | 13790 | 13790 | 13790 | 13790 | 13790 | 13790 |
| 2021-12-31 | 13570 | 13570 | 13570 | 13570 | 13570 | 13570 | 13570 | 13570 | 13570 | 13570 | 13570 | 13570 |
| 2022-12-31 | 13525 | 13525 | 13525 | 13525 | 13525 | 13525 | 13525 | 13525 | 13525 | 13525 | 13525 | 13525 |
import matplotlib.pyplot as pltplt.figure(figsize=(12,5))
plt.plot(df_resampled_year.index, df_resampled_year['Patient_ID'])
plt.title("Trend analysis of Yearly visit")
plt.xlabel('Date')
plt.ylabel('Number of visits')
plt.grid(True)
plt.show()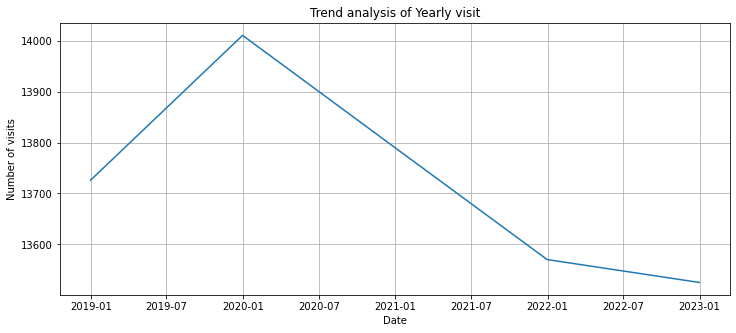
2020년 1월부터 2022년 1월까지 내려오는 경향은 확인해볼 필요가 있음
df_resample_month = df_visit.resample("M").count()
df_resample_month| Patient_ID | Age | Gender | Diagnosis | Has_Insurance | Postcode | Total_Cost | Registration(minutes) | Nursing(minutes) | Laboratory(minutes) | Consultation(minutes) | Pharmacy(minutes) | |
|---|---|---|---|---|---|---|---|---|---|---|---|---|
| Visit_Date | ||||||||||||
| 2018-01-31 | 1176 | 1176 | 1176 | 1176 | 1176 | 1176 | 1176 | 1176 | 1176 | 1176 | 1176 | 1176 |
| 2018-02-28 | 1044 | 1044 | 1044 | 1044 | 1044 | 1044 | 1044 | 1044 | 1044 | 1044 | 1044 | 1044 |
| 2018-03-31 | 1203 | 1203 | 1203 | 1203 | 1203 | 1203 | 1203 | 1203 | 1203 | 1203 | 1203 | 1203 |
| 2018-04-30 | 1054 | 1054 | 1054 | 1054 | 1054 | 1054 | 1054 | 1054 | 1054 | 1054 | 1054 | 1054 |
| 2018-05-31 | 1244 | 1244 | 1244 | 1244 | 1244 | 1244 | 1244 | 1244 | 1244 | 1244 | 1244 | 1244 |
| 2018-06-30 | 1128 | 1128 | 1128 | 1128 | 1128 | 1128 | 1128 | 1128 | 1128 | 1128 | 1128 | 1128 |
| 2018-07-31 | 1133 | 1133 | 1133 | 1133 | 1133 | 1133 | 1133 | 1133 | 1133 | 1133 | 1133 | 1133 |
| 2018-08-31 | 1139 | 1139 | 1139 | 1139 | 1139 | 1139 | 1139 | 1139 | 1139 | 1139 | 1139 | 1139 |
| 2018-09-30 | 1204 | 1204 | 1204 | 1204 | 1204 | 1204 | 1204 | 1204 | 1204 | 1204 | 1204 | 1204 |
| 2018-10-31 | 1147 | 1147 | 1147 | 1147 | 1147 | 1147 | 1147 | 1147 | 1147 | 1147 | 1147 | 1147 |
| 2018-11-30 | 1090 | 1090 | 1090 | 1090 | 1090 | 1090 | 1090 | 1090 | 1090 | 1090 | 1090 | 1090 |
| 2018-12-31 | 1164 | 1164 | 1164 | 1164 | 1164 | 1164 | 1164 | 1164 | 1164 | 1164 | 1164 | 1164 |
| 2019-01-31 | 1194 | 1194 | 1194 | 1194 | 1194 | 1194 | 1194 | 1194 | 1194 | 1194 | 1194 | 1194 |
| 2019-02-28 | 1089 | 1089 | 1089 | 1089 | 1089 | 1089 | 1089 | 1089 | 1089 | 1089 | 1089 | 1089 |
| 2019-03-31 | 1214 | 1214 | 1214 | 1214 | 1214 | 1214 | 1214 | 1214 | 1214 | 1214 | 1214 | 1214 |
| 2019-04-30 | 1140 | 1140 | 1140 | 1140 | 1140 | 1140 | 1140 | 1140 | 1140 | 1140 | 1140 | 1140 |
| 2019-05-31 | 1212 | 1212 | 1212 | 1212 | 1212 | 1212 | 1212 | 1212 | 1212 | 1212 | 1212 | 1212 |
| 2019-06-30 | 1153 | 1153 | 1153 | 1153 | 1153 | 1153 | 1153 | 1153 | 1153 | 1153 | 1153 | 1153 |
| 2019-07-31 | 1113 | 1113 | 1113 | 1113 | 1113 | 1113 | 1113 | 1113 | 1113 | 1113 | 1113 | 1113 |
| 2019-08-31 | 1209 | 1209 | 1209 | 1209 | 1209 | 1209 | 1209 | 1209 | 1209 | 1209 | 1209 | 1209 |
| 2019-09-30 | 1130 | 1130 | 1130 | 1130 | 1130 | 1130 | 1130 | 1130 | 1130 | 1130 | 1130 | 1130 |
| 2019-10-31 | 1197 | 1197 | 1197 | 1197 | 1197 | 1197 | 1197 | 1197 | 1197 | 1197 | 1197 | 1197 |
| 2019-11-30 | 1191 | 1191 | 1191 | 1191 | 1191 | 1191 | 1191 | 1191 | 1191 | 1191 | 1191 | 1191 |
| 2019-12-31 | 1169 | 1169 | 1169 | 1169 | 1169 | 1169 | 1169 | 1169 | 1169 | 1169 | 1169 | 1169 |
| 2020-01-31 | 1171 | 1171 | 1171 | 1171 | 1171 | 1171 | 1171 | 1171 | 1171 | 1171 | 1171 | 1171 |
| 2020-02-29 | 1108 | 1108 | 1108 | 1108 | 1108 | 1108 | 1108 | 1108 | 1108 | 1108 | 1108 | 1108 |
| 2020-03-31 | 1165 | 1165 | 1165 | 1165 | 1165 | 1165 | 1165 | 1165 | 1165 | 1165 | 1165 | 1165 |
| 2020-04-30 | 1105 | 1105 | 1105 | 1105 | 1105 | 1105 | 1105 | 1105 | 1105 | 1105 | 1105 | 1105 |
| 2020-05-31 | 1197 | 1197 | 1197 | 1197 | 1197 | 1197 | 1197 | 1197 | 1197 | 1197 | 1197 | 1197 |
| 2020-06-30 | 1144 | 1144 | 1144 | 1144 | 1144 | 1144 | 1144 | 1144 | 1144 | 1144 | 1144 | 1144 |
| 2020-07-31 | 1195 | 1195 | 1195 | 1195 | 1195 | 1195 | 1195 | 1195 | 1195 | 1195 | 1195 | 1195 |
| 2020-08-31 | 1114 | 1114 | 1114 | 1114 | 1114 | 1114 | 1114 | 1114 | 1114 | 1114 | 1114 | 1114 |
| 2020-09-30 | 1084 | 1084 | 1084 | 1084 | 1084 | 1084 | 1084 | 1084 | 1084 | 1084 | 1084 | 1084 |
| 2020-10-31 | 1201 | 1201 | 1201 | 1201 | 1201 | 1201 | 1201 | 1201 | 1201 | 1201 | 1201 | 1201 |
| 2020-11-30 | 1110 | 1110 | 1110 | 1110 | 1110 | 1110 | 1110 | 1110 | 1110 | 1110 | 1110 | 1110 |
| 2020-12-31 | 1196 | 1196 | 1196 | 1196 | 1196 | 1196 | 1196 | 1196 | 1196 | 1196 | 1196 | 1196 |
| 2021-01-31 | 1162 | 1162 | 1162 | 1162 | 1162 | 1162 | 1162 | 1162 | 1162 | 1162 | 1162 | 1162 |
| 2021-02-28 | 1049 | 1049 | 1049 | 1049 | 1049 | 1049 | 1049 | 1049 | 1049 | 1049 | 1049 | 1049 |
| 2021-03-31 | 1215 | 1215 | 1215 | 1215 | 1215 | 1215 | 1215 | 1215 | 1215 | 1215 | 1215 | 1215 |
| 2021-04-30 | 1139 | 1139 | 1139 | 1139 | 1139 | 1139 | 1139 | 1139 | 1139 | 1139 | 1139 | 1139 |
| 2021-05-31 | 1124 | 1124 | 1124 | 1124 | 1124 | 1124 | 1124 | 1124 | 1124 | 1124 | 1124 | 1124 |
| 2021-06-30 | 1064 | 1064 | 1064 | 1064 | 1064 | 1064 | 1064 | 1064 | 1064 | 1064 | 1064 | 1064 |
| 2021-07-31 | 1181 | 1181 | 1181 | 1181 | 1181 | 1181 | 1181 | 1181 | 1181 | 1181 | 1181 | 1181 |
| 2021-08-31 | 1231 | 1231 | 1231 | 1231 | 1231 | 1231 | 1231 | 1231 | 1231 | 1231 | 1231 | 1231 |
| 2021-09-30 | 1062 | 1062 | 1062 | 1062 | 1062 | 1062 | 1062 | 1062 | 1062 | 1062 | 1062 | 1062 |
| 2021-10-31 | 1179 | 1179 | 1179 | 1179 | 1179 | 1179 | 1179 | 1179 | 1179 | 1179 | 1179 | 1179 |
| 2021-11-30 | 1071 | 1071 | 1071 | 1071 | 1071 | 1071 | 1071 | 1071 | 1071 | 1071 | 1071 | 1071 |
| 2021-12-31 | 1093 | 1093 | 1093 | 1093 | 1093 | 1093 | 1093 | 1093 | 1093 | 1093 | 1093 | 1093 |
| 2022-01-31 | 1164 | 1164 | 1164 | 1164 | 1164 | 1164 | 1164 | 1164 | 1164 | 1164 | 1164 | 1164 |
| 2022-02-28 | 997 | 997 | 997 | 997 | 997 | 997 | 997 | 997 | 997 | 997 | 997 | 997 |
| 2022-03-31 | 1150 | 1150 | 1150 | 1150 | 1150 | 1150 | 1150 | 1150 | 1150 | 1150 | 1150 | 1150 |
| 2022-04-30 | 1143 | 1143 | 1143 | 1143 | 1143 | 1143 | 1143 | 1143 | 1143 | 1143 | 1143 | 1143 |
| 2022-05-31 | 1203 | 1203 | 1203 | 1203 | 1203 | 1203 | 1203 | 1203 | 1203 | 1203 | 1203 | 1203 |
| 2022-06-30 | 1129 | 1129 | 1129 | 1129 | 1129 | 1129 | 1129 | 1129 | 1129 | 1129 | 1129 | 1129 |
| 2022-07-31 | 1163 | 1163 | 1163 | 1163 | 1163 | 1163 | 1163 | 1163 | 1163 | 1163 | 1163 | 1163 |
| 2022-08-31 | 1079 | 1079 | 1079 | 1079 | 1079 | 1079 | 1079 | 1079 | 1079 | 1079 | 1079 | 1079 |
| 2022-09-30 | 1130 | 1130 | 1130 | 1130 | 1130 | 1130 | 1130 | 1130 | 1130 | 1130 | 1130 | 1130 |
| 2022-10-31 | 1191 | 1191 | 1191 | 1191 | 1191 | 1191 | 1191 | 1191 | 1191 | 1191 | 1191 | 1191 |
| 2022-11-30 | 1084 | 1084 | 1084 | 1084 | 1084 | 1084 | 1084 | 1084 | 1084 | 1084 | 1084 | 1084 |
| 2022-12-31 | 1092 | 1092 | 1092 | 1092 | 1092 | 1092 | 1092 | 1092 | 1092 | 1092 | 1092 | 1092 |
plt.figure(figsize=(12,5))
plt.plot(df_resample_month.index, df_resample_month['Patient_ID'])
plt.title("Trend analysis of Monthly visit")
plt.xlabel('Date')
plt.ylabel('Number of visits')
plt.grid(True)
plt.show()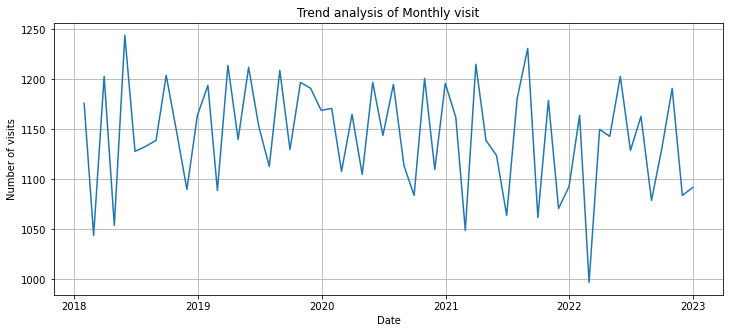
3
import pandas as pddf_visit = pd.read_csv('../../../delete/Demo Hospital Outpatient Data Clean_NHC.csv')df_visit| Visit_Date | Patient_ID | Age | Gender | Diagnosis | Has_Insurance | Postcode | Total_Cost | Registration(minutes) | Nursing(minutes) | Laboratory(minutes) | Consultation(minutes) | Pharmacy(minutes) | |
|---|---|---|---|---|---|---|---|---|---|---|---|---|---|
| 0 | 2020-05-06 | 688923 | 68 | Female | Diabetes | True | 20006 | 2274.0 | 33.0 | 105.0 | 101.0 | 28.0 | 112.0 |
| 1 | 2018-08-04 | 886361 | 62 | Female | Urinary Tract Infection | False | 20005 | 3430.0 | 46.0 | 75.0 | 84.0 | 102.0 | 36.0 |
| 2 | 2021-04-10 | 464823 | 70 | Female | Upper Respiratory Tract Infection | True | 10003 | 1836.0 | 107.0 | 81.0 | 5.0 | 77.0 | 36.0 |
| 3 | 2021-10-01 | 655214 | 8 | Female | Upper Respiratory Tract Infection | False | 10006 | 3250.0 | 66.0 | 31.0 | 101.0 | 35.0 | 92.0 |
| 4 | 2018-04-30 | 454666 | 24 | Male | Malaria | True | 10006 | 2262.0 | 68.0 | 55.0 | 60.0 | 90.0 | 104.0 |
| ... | ... | ... | ... | ... | ... | ... | ... | ... | ... | ... | ... | ... | ... |
| 68617 | 2020-06-22 | 668182 | 10 | Female | Abdominal pain | True | 10006 | 2718.0 | 90.0 | 96.0 | 62.0 | 92.0 | 113.0 |
| 68618 | 2020-09-03 | 484737 | 7 | Male | Abdominal pain | True | 10009 | 2028.0 | 101.0 | 76.0 | 110.0 | 37.0 | 14.0 |
| 68619 | 2021-06-16 | 917198 | 22 | Female | Urinary Tract Infection | True | 20008 | 1212.0 | 66.0 | 80.0 | 15.0 | 36.0 | 5.0 |
| 68620 | 2021-09-15 | 98720 | 22 | Female | Malaria | True | 20006 | 1668.0 | 9.0 | 36.0 | 107.0 | 87.0 | 39.0 |
| 68621 | 2019-12-15 | 251371 | 5 | Male | Malaria | False | 10014 | 1850.0 | 18.0 | 74.0 | 42.0 | 44.0 | 7.0 |
68622 rows × 13 columns
df_visit['Visit_Date'][0]'2020-05-06'type(df_visit['Visit_Date'][0])strdf_visit['Visit_Date'] = pd.to_datetime(df_visit['Visit_Date'])type(df_visit['Visit_Date'][0])pandas._libs.tslibs.timestamps.Timestampdf_visit.set_index('Visit_Date',inplace=True)df_visit| Patient_ID | Age | Gender | Diagnosis | Has_Insurance | Postcode | Total_Cost | Registration(minutes) | Nursing(minutes) | Laboratory(minutes) | Consultation(minutes) | Pharmacy(minutes) | |
|---|---|---|---|---|---|---|---|---|---|---|---|---|
| Visit_Date | ||||||||||||
| 2020-05-06 | 688923 | 68 | Female | Diabetes | True | 20006 | 2274.0 | 33.0 | 105.0 | 101.0 | 28.0 | 112.0 |
| 2018-08-04 | 886361 | 62 | Female | Urinary Tract Infection | False | 20005 | 3430.0 | 46.0 | 75.0 | 84.0 | 102.0 | 36.0 |
| 2021-04-10 | 464823 | 70 | Female | Upper Respiratory Tract Infection | True | 10003 | 1836.0 | 107.0 | 81.0 | 5.0 | 77.0 | 36.0 |
| 2021-10-01 | 655214 | 8 | Female | Upper Respiratory Tract Infection | False | 10006 | 3250.0 | 66.0 | 31.0 | 101.0 | 35.0 | 92.0 |
| 2018-04-30 | 454666 | 24 | Male | Malaria | True | 10006 | 2262.0 | 68.0 | 55.0 | 60.0 | 90.0 | 104.0 |
| ... | ... | ... | ... | ... | ... | ... | ... | ... | ... | ... | ... | ... |
| 2020-06-22 | 668182 | 10 | Female | Abdominal pain | True | 10006 | 2718.0 | 90.0 | 96.0 | 62.0 | 92.0 | 113.0 |
| 2020-09-03 | 484737 | 7 | Male | Abdominal pain | True | 10009 | 2028.0 | 101.0 | 76.0 | 110.0 | 37.0 | 14.0 |
| 2021-06-16 | 917198 | 22 | Female | Urinary Tract Infection | True | 20008 | 1212.0 | 66.0 | 80.0 | 15.0 | 36.0 | 5.0 |
| 2021-09-15 | 98720 | 22 | Female | Malaria | True | 20006 | 1668.0 | 9.0 | 36.0 | 107.0 | 87.0 | 39.0 |
| 2019-12-15 | 251371 | 5 | Male | Malaria | False | 10014 | 1850.0 | 18.0 | 74.0 | 42.0 | 44.0 | 7.0 |
68622 rows × 12 columns
df_resampled_year = df_visit.resample("Y").count()df_resampled_year| Patient_ID | Age | Gender | Diagnosis | Has_Insurance | Postcode | Total_Cost | Registration(minutes) | Nursing(minutes) | Laboratory(minutes) | Consultation(minutes) | Pharmacy(minutes) | |
|---|---|---|---|---|---|---|---|---|---|---|---|---|
| Visit_Date | ||||||||||||
| 2018-12-31 | 13726 | 13726 | 13726 | 13726 | 13726 | 13726 | 13726 | 13726 | 13726 | 13726 | 13726 | 13726 |
| 2019-12-31 | 14011 | 14011 | 14011 | 14011 | 14011 | 14011 | 14011 | 14011 | 14011 | 14011 | 14011 | 14011 |
| 2020-12-31 | 13790 | 13790 | 13790 | 13790 | 13790 | 13790 | 13790 | 13790 | 13790 | 13790 | 13790 | 13790 |
| 2021-12-31 | 13570 | 13570 | 13570 | 13570 | 13570 | 13570 | 13570 | 13570 | 13570 | 13570 | 13570 | 13570 |
| 2022-12-31 | 13525 | 13525 | 13525 | 13525 | 13525 | 13525 | 13525 | 13525 | 13525 | 13525 | 13525 | 13525 |
import matplotlib.pyplot as pltplt.figure(figsize=(12,6))
plt.plot(df_resampled_year.index, df_resampled_year['Patient_ID'])
plt.title("Trend analysis of Yearly visit")Text(0.5, 1.0, 'Trend analysis of Yearly visit')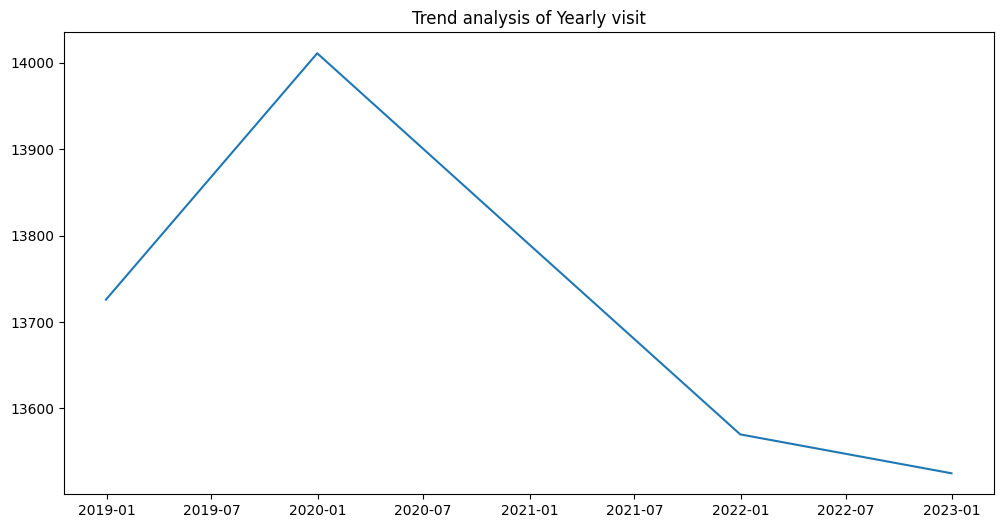
plt.figure(figsize=(12,5))
plt.plot(df_resampled_year.index, df_resampled_year['Patient_ID'])
plt.title("Trend analysis of Yearly visit")
plt.xlabel('Date')
plt.ylabel('Number of visits')
plt.grid(True)
plt.show()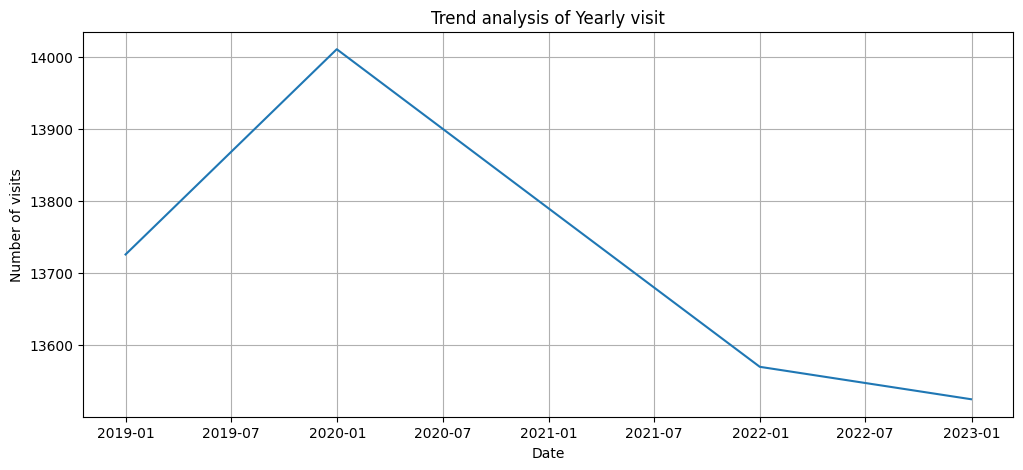
df_resample_month = df_visit.resample("M").count()df_resample_month| Patient_ID | Age | Gender | Diagnosis | Has_Insurance | Postcode | Total_Cost | Registration(minutes) | Nursing(minutes) | Laboratory(minutes) | Consultation(minutes) | Pharmacy(minutes) | |
|---|---|---|---|---|---|---|---|---|---|---|---|---|
| Visit_Date | ||||||||||||
| 2018-01-31 | 1176 | 1176 | 1176 | 1176 | 1176 | 1176 | 1176 | 1176 | 1176 | 1176 | 1176 | 1176 |
| 2018-02-28 | 1044 | 1044 | 1044 | 1044 | 1044 | 1044 | 1044 | 1044 | 1044 | 1044 | 1044 | 1044 |
| 2018-03-31 | 1203 | 1203 | 1203 | 1203 | 1203 | 1203 | 1203 | 1203 | 1203 | 1203 | 1203 | 1203 |
| 2018-04-30 | 1054 | 1054 | 1054 | 1054 | 1054 | 1054 | 1054 | 1054 | 1054 | 1054 | 1054 | 1054 |
| 2018-05-31 | 1244 | 1244 | 1244 | 1244 | 1244 | 1244 | 1244 | 1244 | 1244 | 1244 | 1244 | 1244 |
| 2018-06-30 | 1128 | 1128 | 1128 | 1128 | 1128 | 1128 | 1128 | 1128 | 1128 | 1128 | 1128 | 1128 |
| 2018-07-31 | 1133 | 1133 | 1133 | 1133 | 1133 | 1133 | 1133 | 1133 | 1133 | 1133 | 1133 | 1133 |
| 2018-08-31 | 1139 | 1139 | 1139 | 1139 | 1139 | 1139 | 1139 | 1139 | 1139 | 1139 | 1139 | 1139 |
| 2018-09-30 | 1204 | 1204 | 1204 | 1204 | 1204 | 1204 | 1204 | 1204 | 1204 | 1204 | 1204 | 1204 |
| 2018-10-31 | 1147 | 1147 | 1147 | 1147 | 1147 | 1147 | 1147 | 1147 | 1147 | 1147 | 1147 | 1147 |
| 2018-11-30 | 1090 | 1090 | 1090 | 1090 | 1090 | 1090 | 1090 | 1090 | 1090 | 1090 | 1090 | 1090 |
| 2018-12-31 | 1164 | 1164 | 1164 | 1164 | 1164 | 1164 | 1164 | 1164 | 1164 | 1164 | 1164 | 1164 |
| 2019-01-31 | 1194 | 1194 | 1194 | 1194 | 1194 | 1194 | 1194 | 1194 | 1194 | 1194 | 1194 | 1194 |
| 2019-02-28 | 1089 | 1089 | 1089 | 1089 | 1089 | 1089 | 1089 | 1089 | 1089 | 1089 | 1089 | 1089 |
| 2019-03-31 | 1214 | 1214 | 1214 | 1214 | 1214 | 1214 | 1214 | 1214 | 1214 | 1214 | 1214 | 1214 |
| 2019-04-30 | 1140 | 1140 | 1140 | 1140 | 1140 | 1140 | 1140 | 1140 | 1140 | 1140 | 1140 | 1140 |
| 2019-05-31 | 1212 | 1212 | 1212 | 1212 | 1212 | 1212 | 1212 | 1212 | 1212 | 1212 | 1212 | 1212 |
| 2019-06-30 | 1153 | 1153 | 1153 | 1153 | 1153 | 1153 | 1153 | 1153 | 1153 | 1153 | 1153 | 1153 |
| 2019-07-31 | 1113 | 1113 | 1113 | 1113 | 1113 | 1113 | 1113 | 1113 | 1113 | 1113 | 1113 | 1113 |
| 2019-08-31 | 1209 | 1209 | 1209 | 1209 | 1209 | 1209 | 1209 | 1209 | 1209 | 1209 | 1209 | 1209 |
| 2019-09-30 | 1130 | 1130 | 1130 | 1130 | 1130 | 1130 | 1130 | 1130 | 1130 | 1130 | 1130 | 1130 |
| 2019-10-31 | 1197 | 1197 | 1197 | 1197 | 1197 | 1197 | 1197 | 1197 | 1197 | 1197 | 1197 | 1197 |
| 2019-11-30 | 1191 | 1191 | 1191 | 1191 | 1191 | 1191 | 1191 | 1191 | 1191 | 1191 | 1191 | 1191 |
| 2019-12-31 | 1169 | 1169 | 1169 | 1169 | 1169 | 1169 | 1169 | 1169 | 1169 | 1169 | 1169 | 1169 |
| 2020-01-31 | 1171 | 1171 | 1171 | 1171 | 1171 | 1171 | 1171 | 1171 | 1171 | 1171 | 1171 | 1171 |
| 2020-02-29 | 1108 | 1108 | 1108 | 1108 | 1108 | 1108 | 1108 | 1108 | 1108 | 1108 | 1108 | 1108 |
| 2020-03-31 | 1165 | 1165 | 1165 | 1165 | 1165 | 1165 | 1165 | 1165 | 1165 | 1165 | 1165 | 1165 |
| 2020-04-30 | 1105 | 1105 | 1105 | 1105 | 1105 | 1105 | 1105 | 1105 | 1105 | 1105 | 1105 | 1105 |
| 2020-05-31 | 1197 | 1197 | 1197 | 1197 | 1197 | 1197 | 1197 | 1197 | 1197 | 1197 | 1197 | 1197 |
| 2020-06-30 | 1144 | 1144 | 1144 | 1144 | 1144 | 1144 | 1144 | 1144 | 1144 | 1144 | 1144 | 1144 |
| 2020-07-31 | 1195 | 1195 | 1195 | 1195 | 1195 | 1195 | 1195 | 1195 | 1195 | 1195 | 1195 | 1195 |
| 2020-08-31 | 1114 | 1114 | 1114 | 1114 | 1114 | 1114 | 1114 | 1114 | 1114 | 1114 | 1114 | 1114 |
| 2020-09-30 | 1084 | 1084 | 1084 | 1084 | 1084 | 1084 | 1084 | 1084 | 1084 | 1084 | 1084 | 1084 |
| 2020-10-31 | 1201 | 1201 | 1201 | 1201 | 1201 | 1201 | 1201 | 1201 | 1201 | 1201 | 1201 | 1201 |
| 2020-11-30 | 1110 | 1110 | 1110 | 1110 | 1110 | 1110 | 1110 | 1110 | 1110 | 1110 | 1110 | 1110 |
| 2020-12-31 | 1196 | 1196 | 1196 | 1196 | 1196 | 1196 | 1196 | 1196 | 1196 | 1196 | 1196 | 1196 |
| 2021-01-31 | 1162 | 1162 | 1162 | 1162 | 1162 | 1162 | 1162 | 1162 | 1162 | 1162 | 1162 | 1162 |
| 2021-02-28 | 1049 | 1049 | 1049 | 1049 | 1049 | 1049 | 1049 | 1049 | 1049 | 1049 | 1049 | 1049 |
| 2021-03-31 | 1215 | 1215 | 1215 | 1215 | 1215 | 1215 | 1215 | 1215 | 1215 | 1215 | 1215 | 1215 |
| 2021-04-30 | 1139 | 1139 | 1139 | 1139 | 1139 | 1139 | 1139 | 1139 | 1139 | 1139 | 1139 | 1139 |
| 2021-05-31 | 1124 | 1124 | 1124 | 1124 | 1124 | 1124 | 1124 | 1124 | 1124 | 1124 | 1124 | 1124 |
| 2021-06-30 | 1064 | 1064 | 1064 | 1064 | 1064 | 1064 | 1064 | 1064 | 1064 | 1064 | 1064 | 1064 |
| 2021-07-31 | 1181 | 1181 | 1181 | 1181 | 1181 | 1181 | 1181 | 1181 | 1181 | 1181 | 1181 | 1181 |
| 2021-08-31 | 1231 | 1231 | 1231 | 1231 | 1231 | 1231 | 1231 | 1231 | 1231 | 1231 | 1231 | 1231 |
| 2021-09-30 | 1062 | 1062 | 1062 | 1062 | 1062 | 1062 | 1062 | 1062 | 1062 | 1062 | 1062 | 1062 |
| 2021-10-31 | 1179 | 1179 | 1179 | 1179 | 1179 | 1179 | 1179 | 1179 | 1179 | 1179 | 1179 | 1179 |
| 2021-11-30 | 1071 | 1071 | 1071 | 1071 | 1071 | 1071 | 1071 | 1071 | 1071 | 1071 | 1071 | 1071 |
| 2021-12-31 | 1093 | 1093 | 1093 | 1093 | 1093 | 1093 | 1093 | 1093 | 1093 | 1093 | 1093 | 1093 |
| 2022-01-31 | 1164 | 1164 | 1164 | 1164 | 1164 | 1164 | 1164 | 1164 | 1164 | 1164 | 1164 | 1164 |
| 2022-02-28 | 997 | 997 | 997 | 997 | 997 | 997 | 997 | 997 | 997 | 997 | 997 | 997 |
| 2022-03-31 | 1150 | 1150 | 1150 | 1150 | 1150 | 1150 | 1150 | 1150 | 1150 | 1150 | 1150 | 1150 |
| 2022-04-30 | 1143 | 1143 | 1143 | 1143 | 1143 | 1143 | 1143 | 1143 | 1143 | 1143 | 1143 | 1143 |
| 2022-05-31 | 1203 | 1203 | 1203 | 1203 | 1203 | 1203 | 1203 | 1203 | 1203 | 1203 | 1203 | 1203 |
| 2022-06-30 | 1129 | 1129 | 1129 | 1129 | 1129 | 1129 | 1129 | 1129 | 1129 | 1129 | 1129 | 1129 |
| 2022-07-31 | 1163 | 1163 | 1163 | 1163 | 1163 | 1163 | 1163 | 1163 | 1163 | 1163 | 1163 | 1163 |
| 2022-08-31 | 1079 | 1079 | 1079 | 1079 | 1079 | 1079 | 1079 | 1079 | 1079 | 1079 | 1079 | 1079 |
| 2022-09-30 | 1130 | 1130 | 1130 | 1130 | 1130 | 1130 | 1130 | 1130 | 1130 | 1130 | 1130 | 1130 |
| 2022-10-31 | 1191 | 1191 | 1191 | 1191 | 1191 | 1191 | 1191 | 1191 | 1191 | 1191 | 1191 | 1191 |
| 2022-11-30 | 1084 | 1084 | 1084 | 1084 | 1084 | 1084 | 1084 | 1084 | 1084 | 1084 | 1084 | 1084 |
| 2022-12-31 | 1092 | 1092 | 1092 | 1092 | 1092 | 1092 | 1092 | 1092 | 1092 | 1092 | 1092 | 1092 |
plt.figure(figsize=(12,5))
plt.plot(df_resample_month.index, df_resample_month['Patient_ID'])
plt.title("Trend analysis of Monthly visit")
plt.xlabel('Date')
plt.ylabel('Number of visits')
plt.grid(True)
plt.show()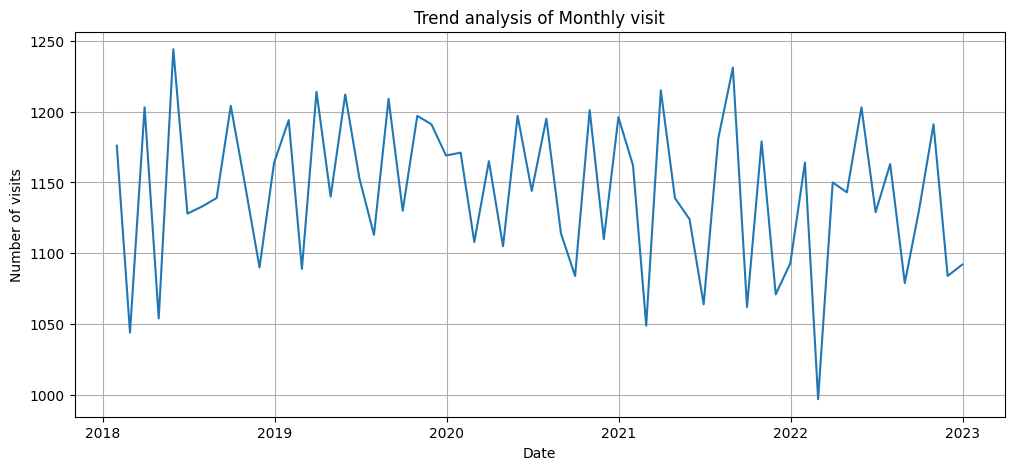
##Trend Analysis of Patient Visit Demo Dataset Part II
monthly_ticks = pd.date_range(start=df_resample_month.index.min(),end =df_resample_month.index.max(),freq="M")
monthly_labels = [date.strftime('%b%Y') for date in monthly_ticks]
plt.figure(figsize=(12,5))
plt.plot(df_resample_month.index, df_resample_month['Patient_ID'])
plt.title("Trend analysis of Monthly visit")
plt.xticks(monthly_ticks,monthly_labels,rotation=90)
plt.xlabel('Date')
plt.ylabel('Number of visits')
plt.grid(True)
plt.show()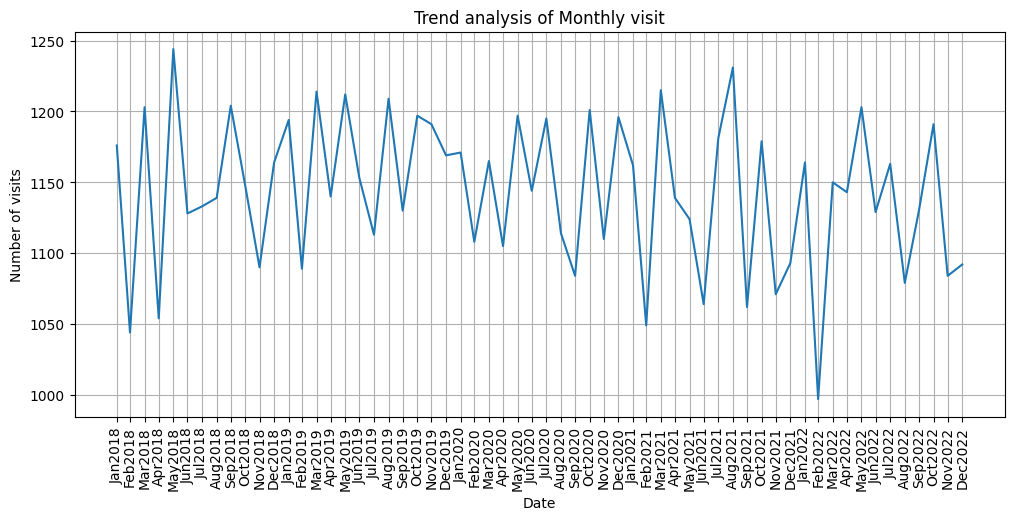
target_month = 2

df_target_month = df_resample_month[df_resample_month.index.month == target_month]
plt.figure(figsize=(12,5))
plt.plot(df_target_month.index, df_target_month['Postcode'])
plt.title(f'Trend for {df_target_month.index[0].strftime("%B")} Across Five Years')
plt.xlabel('Date')
plt.ylabel('Number of visits')
plt.grid(True)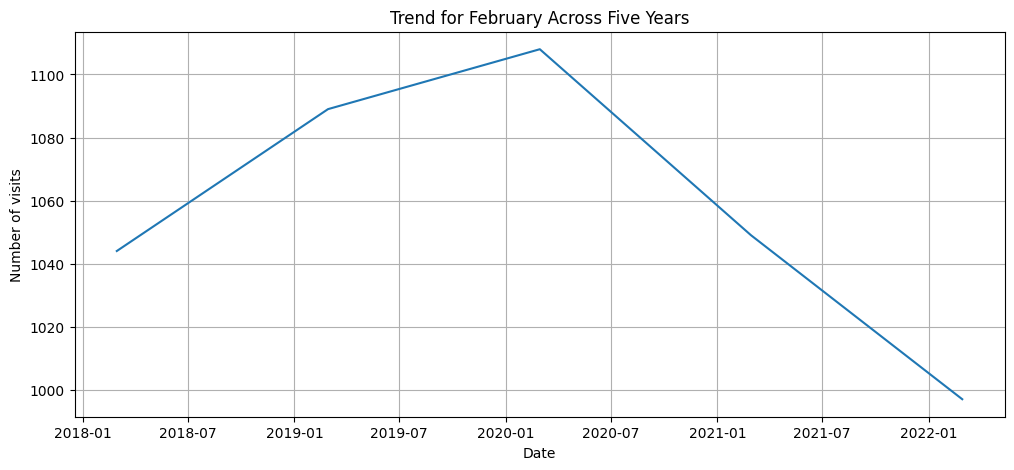
target_month = 11

df_target_month = df_resample_month[df_resample_month.index.month == target_month]
plt.figure(figsize=(12,5))
plt.plot(df_target_month.index, df_target_month['Postcode'])
plt.title(f'Trend for {df_target_month.index[0].strftime("%B")} Across Five Years')
plt.xlabel('Date')
plt.ylabel('Number of visits')
plt.grid(True)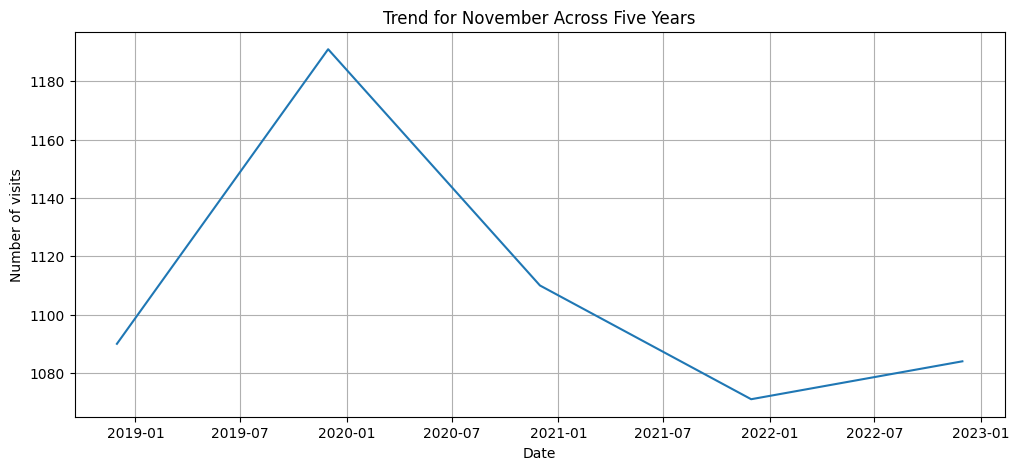
import pandas as pd
import matplotlib.pyplot as plt
df_visit = pd.read_csv('/content/demo_hospital_outpatient_data_clean.zip')
df_visit.head()| Visit_Date | Patient_ID | Age | Gender | Diagnosis | Has_Insurance | Postcode | Total_Cost | Registration(minutes) | Nursing(minutes) | Laboratory(minutes) | Consultation(minutes) | Pharmacy(minutes) | |
|---|---|---|---|---|---|---|---|---|---|---|---|---|---|
| 0 | 2020-05-06 | 688923 | 68 | Female | Diabetes | True | 20006 | 2274.0 | 33.0 | 105.0 | 101.0 | 28.0 | 112.0 |
| 1 | 2018-08-04 | 886361 | 62 | Female | Urinary Tract Infection | False | 20005 | 3430.0 | 46.0 | 75.0 | 84.0 | 102.0 | 36.0 |
| 2 | 2021-04-10 | 464823 | 70 | Female | Upper Respiratory Tract Infection | True | 10003 | 1836.0 | 107.0 | 81.0 | 5.0 | 77.0 | 36.0 |
| 3 | 2021-10-01 | 655214 | 8 | Female | Upper Respiratory Tract Infection | False | 10006 | 3250.0 | 66.0 | 31.0 | 101.0 | 35.0 | 92.0 |
| 4 | 2018-04-30 | 454666 | 24 | Male | Malaria | True | 10006 | 2262.0 | 68.0 | 55.0 | 60.0 | 90.0 | 104.0 |
df_visit['Total_Time(minutes)'] = df_visit['Registration(minutes)'] + df_visit['Nursing(minutes)'] + df_visit['Laboratory(minutes)'] + df_visit['Consultation(minutes)'] + df_visit['Pharmacy(minutes)']df_visit.head()| Visit_Date | Patient_ID | Age | Gender | Diagnosis | Has_Insurance | Postcode | Total_Cost | Registration(minutes) | Nursing(minutes) | Laboratory(minutes) | Consultation(minutes) | Pharmacy(minutes) | Total_Time(minutes) | |
|---|---|---|---|---|---|---|---|---|---|---|---|---|---|---|
| 0 | 2020-05-06 | 688923 | 68 | Female | Diabetes | True | 20006 | 2274.0 | 33.0 | 105.0 | 101.0 | 28.0 | 112.0 | 379.0 |
| 1 | 2018-08-04 | 886361 | 62 | Female | Urinary Tract Infection | False | 20005 | 3430.0 | 46.0 | 75.0 | 84.0 | 102.0 | 36.0 | 343.0 |
| 2 | 2021-04-10 | 464823 | 70 | Female | Upper Respiratory Tract Infection | True | 10003 | 1836.0 | 107.0 | 81.0 | 5.0 | 77.0 | 36.0 | 306.0 |
| 3 | 2021-10-01 | 655214 | 8 | Female | Upper Respiratory Tract Infection | False | 10006 | 3250.0 | 66.0 | 31.0 | 101.0 | 35.0 | 92.0 | 325.0 |
| 4 | 2018-04-30 | 454666 | 24 | Male | Malaria | True | 10006 | 2262.0 | 68.0 | 55.0 | 60.0 | 90.0 | 104.0 | 377.0 |
df_visit['Total_Time(hours)'] = df_visit['Total_Time(minutes)'] / 60
df_visit.head()| Visit_Date | Patient_ID | Age | Gender | Diagnosis | Has_Insurance | Postcode | Total_Cost | Registration(minutes) | Nursing(minutes) | Laboratory(minutes) | Consultation(minutes) | Pharmacy(minutes) | Total_Time(minutes) | Total_Time(hours) | |
|---|---|---|---|---|---|---|---|---|---|---|---|---|---|---|---|
| 0 | 2020-05-06 | 688923 | 68 | Female | Diabetes | True | 20006 | 2274.0 | 33.0 | 105.0 | 101.0 | 28.0 | 112.0 | 379.0 | 6.316667 |
| 1 | 2018-08-04 | 886361 | 62 | Female | Urinary Tract Infection | False | 20005 | 3430.0 | 46.0 | 75.0 | 84.0 | 102.0 | 36.0 | 343.0 | 5.716667 |
| 2 | 2021-04-10 | 464823 | 70 | Female | Upper Respiratory Tract Infection | True | 10003 | 1836.0 | 107.0 | 81.0 | 5.0 | 77.0 | 36.0 | 306.0 | 5.100000 |
| 3 | 2021-10-01 | 655214 | 8 | Female | Upper Respiratory Tract Infection | False | 10006 | 3250.0 | 66.0 | 31.0 | 101.0 | 35.0 | 92.0 | 325.0 | 5.416667 |
| 4 | 2018-04-30 | 454666 | 24 | Male | Malaria | True | 10006 | 2262.0 | 68.0 | 55.0 | 60.0 | 90.0 | 104.0 | 377.0 | 6.283333 |
average_total_time_in_hours = df_visit['Total_Time(hours)'].mean()
average_total_time_in_hours5.209994608143162max_time_department = df_visit[['Consultation(minutes)','Registration(minutes)','Nursing(minutes)','Laboratory(minutes)','Pharmacy(minutes)']].sum().idxmax()max_time_department'Registration(minutes)'df_visit['Registration(minutes)'].max()120.0df_visit['Registration(minutes)'].min()5.04
import pandas as pd
import matplotlib.pyplot as plt
df_visit = pd.read_csv('../../../delete/Demo Hospital Outpatient Data Clean_NHC.csv')
df_visit.head()| Visit_Date | Patient_ID | Age | Gender | Diagnosis | Has_Insurance | Postcode | Total_Cost | Registration(minutes) | Nursing(minutes) | Laboratory(minutes) | Consultation(minutes) | Pharmacy(minutes) | |
|---|---|---|---|---|---|---|---|---|---|---|---|---|---|
| 0 | 2020-05-06 | 688923 | 68 | Female | Diabetes | True | 20006 | 2274.0 | 33.0 | 105.0 | 101.0 | 28.0 | 112.0 |
| 1 | 2018-08-04 | 886361 | 62 | Female | Urinary Tract Infection | False | 20005 | 3430.0 | 46.0 | 75.0 | 84.0 | 102.0 | 36.0 |
| 2 | 2021-04-10 | 464823 | 70 | Female | Upper Respiratory Tract Infection | True | 10003 | 1836.0 | 107.0 | 81.0 | 5.0 | 77.0 | 36.0 |
| 3 | 2021-10-01 | 655214 | 8 | Female | Upper Respiratory Tract Infection | False | 10006 | 3250.0 | 66.0 | 31.0 | 101.0 | 35.0 | 92.0 |
| 4 | 2018-04-30 | 454666 | 24 | Male | Malaria | True | 10006 | 2262.0 | 68.0 | 55.0 | 60.0 | 90.0 | 104.0 |
df_visit['Total_Time(minutes)'] = df_visit['Registration(minutes)'] + df_visit['Nursing(minutes)'] + df_visit['Laboratory(minutes)'] + df_visit['Consultation(minutes)'] + df_visit['Pharmacy(minutes)']총 걸린 시간을 확인하기 위해 합 구하기
df_visit.head()| Visit_Date | Patient_ID | Age | Gender | Diagnosis | Has_Insurance | Postcode | Total_Cost | Registration(minutes) | Nursing(minutes) | Laboratory(minutes) | Consultation(minutes) | Pharmacy(minutes) | Total_Time(minutes) | |
|---|---|---|---|---|---|---|---|---|---|---|---|---|---|---|
| 0 | 2020-05-06 | 688923 | 68 | Female | Diabetes | True | 20006 | 2274.0 | 33.0 | 105.0 | 101.0 | 28.0 | 112.0 | 379.0 |
| 1 | 2018-08-04 | 886361 | 62 | Female | Urinary Tract Infection | False | 20005 | 3430.0 | 46.0 | 75.0 | 84.0 | 102.0 | 36.0 | 343.0 |
| 2 | 2021-04-10 | 464823 | 70 | Female | Upper Respiratory Tract Infection | True | 10003 | 1836.0 | 107.0 | 81.0 | 5.0 | 77.0 | 36.0 | 306.0 |
| 3 | 2021-10-01 | 655214 | 8 | Female | Upper Respiratory Tract Infection | False | 10006 | 3250.0 | 66.0 | 31.0 | 101.0 | 35.0 | 92.0 | 325.0 |
| 4 | 2018-04-30 | 454666 | 24 | Male | Malaria | True | 10006 | 2262.0 | 68.0 | 55.0 | 60.0 | 90.0 | 104.0 | 377.0 |
df_visit['Total_Time(hours)'] = df_visit['Total_Time(minutes)'] / 60
df_visit.head()| Visit_Date | Patient_ID | Age | Gender | Diagnosis | Has_Insurance | Postcode | Total_Cost | Registration(minutes) | Nursing(minutes) | Laboratory(minutes) | Consultation(minutes) | Pharmacy(minutes) | Total_Time(minutes) | Total_Time(hours) | |
|---|---|---|---|---|---|---|---|---|---|---|---|---|---|---|---|
| 0 | 2020-05-06 | 688923 | 68 | Female | Diabetes | True | 20006 | 2274.0 | 33.0 | 105.0 | 101.0 | 28.0 | 112.0 | 379.0 | 6.316667 |
| 1 | 2018-08-04 | 886361 | 62 | Female | Urinary Tract Infection | False | 20005 | 3430.0 | 46.0 | 75.0 | 84.0 | 102.0 | 36.0 | 343.0 | 5.716667 |
| 2 | 2021-04-10 | 464823 | 70 | Female | Upper Respiratory Tract Infection | True | 10003 | 1836.0 | 107.0 | 81.0 | 5.0 | 77.0 | 36.0 | 306.0 | 5.100000 |
| 3 | 2021-10-01 | 655214 | 8 | Female | Upper Respiratory Tract Infection | False | 10006 | 3250.0 | 66.0 | 31.0 | 101.0 | 35.0 | 92.0 | 325.0 | 5.416667 |
| 4 | 2018-04-30 | 454666 | 24 | Male | Malaria | True | 10006 | 2262.0 | 68.0 | 55.0 | 60.0 | 90.0 | 104.0 | 377.0 | 6.283333 |
분을 시간단위호 수정
average_total_time_in_hours = df_visit['Total_Time(hours)'].mean()
average_total_time_in_hours5.209994608143162평균 걸리는 시간은 5시간 정도
max_time_department = df_visit[['Consultation(minutes)','Registration(minutes)','Nursing(minutes)','Laboratory(minutes)','Pharmacy(minutes)']].sum().idxmax()max_time_department'Registration(minutes)'가장 오래 걸린 시간은 등록시간
df_visit['Registration(minutes)'].max()120.0df_visit['Registration(minutes)'].min()5.02시간이 제일 길고 5분이 제일 짧은 등록시간
def department_wait_time_statistics(df, wait_time_column):
    wait_time_minutes = df[wait_time_column]
    wait_time_hours = wait_time_minutes / 60

    min_time = wait_time_hours.min()
    max_time = wait_time_hours.max()
    mean_time = wait_time_hours.mean()
    median_time = wait_time_hours.median()
    std_dev = wait_time_hours.std()

    sentence = f"For the department'{wait_time_column}', wait times range from {min_time:.2f} hours to {max_time:.2f} hours "\
    f"The average wait time is {mean_time:.2f} hours, with a median of {median_time:.2f} hours" \
    f"The standard deviation is {std_dev:.2f} hours"

    return sentence
함수 만들건데 기다리는 시간을 시간단위로 표현하고 평균 및 표준평차를 구해보자
department_wait_time_statistics(df_visit,'Nursing(minutes)')"For the department'Nursing(minutes)', wait times range from 0.08 hours to 2.00 hours The average wait time is 1.04 hours, with a median of 1.03 hoursThe standard deviation is 0.56 hours"wait_time_column에 잘못된 열 쓰면 에러남
def department_wait_time_statistics(df, department_name):
    if department_name not in df.columns:
        return f"Department '{department_name}' not found in the DataFrame"
    wait_time_minutes = df[department_name]
    wait_time_hours = wait_time_minutes / 60

    min_time = wait_time_hours.min()
    max_time = wait_time_hours.max()
    mean_time = wait_time_hours.mean()
    median_time = wait_time_hours.median()
    std_dev = wait_time_hours.std()

    sentence = f"For the department'{department_name}', wait times range from {min_time:.2f} hours to {max_time:.2f} hours "\
    f"The average wait time is {mean_time:.2f} hours, with a median of {median_time:.2f} hours" \
    f"The standard deviation is {std_dev:.2f} hours"

    return sentence
그 에러 나오지 않게 없으면 없다고 해주자
department_wait_time_statistics(df_visit,'Nursing(seconds)')"Department 'Nursing(seconds)' not found in the DataFrame"import pandas as pd
import matplotlib.pyplot as plt
import seaborn as snsdf_visit = pd.read_csv('../../../delete/Demo Hospital Outpatient Data Clean_NHC.csv')df_visit| Visit_Date | Patient_ID | Age | Gender | Diagnosis | Has_Insurance | Postcode | Total_Cost | Registration(minutes) | Nursing(minutes) | Laboratory(minutes) | Consultation(minutes) | Pharmacy(minutes) | |
|---|---|---|---|---|---|---|---|---|---|---|---|---|---|
| 0 | 2020-05-06 | 688923 | 68 | Female | Diabetes | True | 20006 | 2274.0 | 33.0 | 105.0 | 101.0 | 28.0 | 112.0 |
| 1 | 2018-08-04 | 886361 | 62 | Female | Urinary Tract Infection | False | 20005 | 3430.0 | 46.0 | 75.0 | 84.0 | 102.0 | 36.0 |
| 2 | 2021-04-10 | 464823 | 70 | Female | Upper Respiratory Tract Infection | True | 10003 | 1836.0 | 107.0 | 81.0 | 5.0 | 77.0 | 36.0 |
| 3 | 2021-10-01 | 655214 | 8 | Female | Upper Respiratory Tract Infection | False | 10006 | 3250.0 | 66.0 | 31.0 | 101.0 | 35.0 | 92.0 |
| 4 | 2018-04-30 | 454666 | 24 | Male | Malaria | True | 10006 | 2262.0 | 68.0 | 55.0 | 60.0 | 90.0 | 104.0 |
| ... | ... | ... | ... | ... | ... | ... | ... | ... | ... | ... | ... | ... | ... |
| 68617 | 2020-06-22 | 668182 | 10 | Female | Abdominal pain | True | 10006 | 2718.0 | 90.0 | 96.0 | 62.0 | 92.0 | 113.0 |
| 68618 | 2020-09-03 | 484737 | 7 | Male | Abdominal pain | True | 10009 | 2028.0 | 101.0 | 76.0 | 110.0 | 37.0 | 14.0 |
| 68619 | 2021-06-16 | 917198 | 22 | Female | Urinary Tract Infection | True | 20008 | 1212.0 | 66.0 | 80.0 | 15.0 | 36.0 | 5.0 |
| 68620 | 2021-09-15 | 98720 | 22 | Female | Malaria | True | 20006 | 1668.0 | 9.0 | 36.0 | 107.0 | 87.0 | 39.0 |
| 68621 | 2019-12-15 | 251371 | 5 | Male | Malaria | False | 10014 | 1850.0 | 18.0 | 74.0 | 42.0 | 44.0 | 7.0 |
68622 rows × 13 columns
df_visit.corr()FutureWarning: The default value of numeric_only in DataFrame.corr is deprecated. In a future version, it will default to False. Select only valid columns or specify the value of numeric_only to silence this warning.
df_visit.corr()| Patient_ID | Age | Has_Insurance | Postcode | Total_Cost | Registration(minutes) | Nursing(minutes) | Laboratory(minutes) | Consultation(minutes) | Pharmacy(minutes) | |
|---|---|---|---|---|---|---|---|---|---|---|
| Patient_ID | 1.000000 | 0.000077 | 0.001280 | -0.003039 | -0.001706 | -0.000181 | 0.000528 | 0.001289 | -0.003383 | 0.004855 |
| Age | 0.000077 | 1.000000 | -0.006183 | -0.007062 | 0.005582 | 0.001380 | 0.006102 | -0.000094 | -0.006555 | 0.001089 |
| Has_Insurance | 0.001280 | -0.006183 | 1.000000 | 0.000061 | -0.686192 | -0.005191 | 0.002715 | 0.002774 | 0.001841 | -0.000238 |
| Postcode | -0.003039 | -0.007062 | 0.000061 | 1.000000 | -0.002613 | -0.001371 | 0.003667 | -0.006848 | 0.000620 | -0.007727 |
| Total_Cost | -0.001706 | 0.005582 | -0.686192 | -0.002613 | 1.000000 | 0.324229 | 0.313505 | 0.315786 | 0.316663 | 0.320307 |
| Registration(minutes) | -0.000181 | 0.001380 | -0.005191 | -0.001371 | 0.324229 | 1.000000 | 0.000429 | 0.005553 | 0.001579 | 0.010771 |
| Nursing(minutes) | 0.000528 | 0.006102 | 0.002715 | 0.003667 | 0.313505 | 0.000429 | 1.000000 | -0.001732 | 0.002945 | 0.002302 |
| Laboratory(minutes) | 0.001289 | -0.000094 | 0.002774 | -0.006848 | 0.315786 | 0.005553 | -0.001732 | 1.000000 | 0.000336 | -0.001103 |
| Consultation(minutes) | -0.003383 | -0.006555 | 0.001841 | 0.000620 | 0.316663 | 0.001579 | 0.002945 | 0.000336 | 1.000000 | 0.003200 |
| Pharmacy(minutes) | 0.004855 | 0.001089 | -0.000238 | -0.007727 | 0.320307 | 0.010771 | 0.002302 | -0.001103 | 0.003200 | 1.000000 |
상관계수 구해보자
correlation_matrix = df_visit.corr()FutureWarning: The default value of numeric_only in DataFrame.corr is deprecated. In a future version, it will default to False. Select only valid columns or specify the value of numeric_only to silence this warning.
correlation_matrix = df_visit.corr()sns.heatmap(correlation_matrix)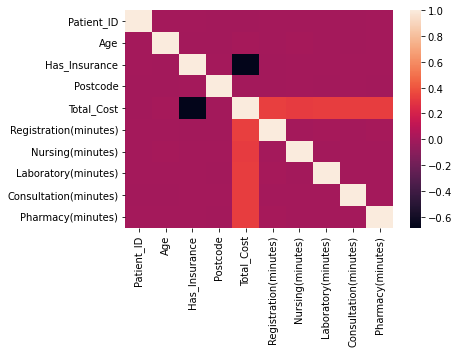
히트맵으로 그려서 시각적으로 보기 쉽게 나타내기
sns.heatmap(correlation_matrix,annot=True)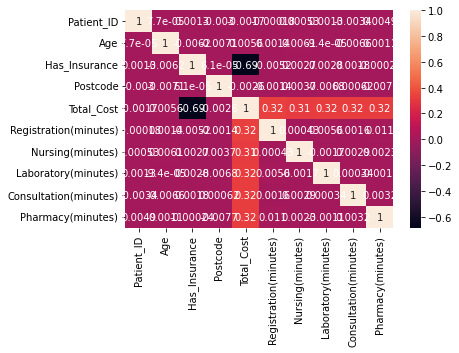
annot은 소수점 나오게 하는 옵션
plt.figure(figsize=(12,5))
sns.heatmap(correlation_matrix,annot=True,cmap='viridis',fmt=".2f",linewidths=0.5)
plt.title("Correlation heatmap for the hospital visit data")
plt.show()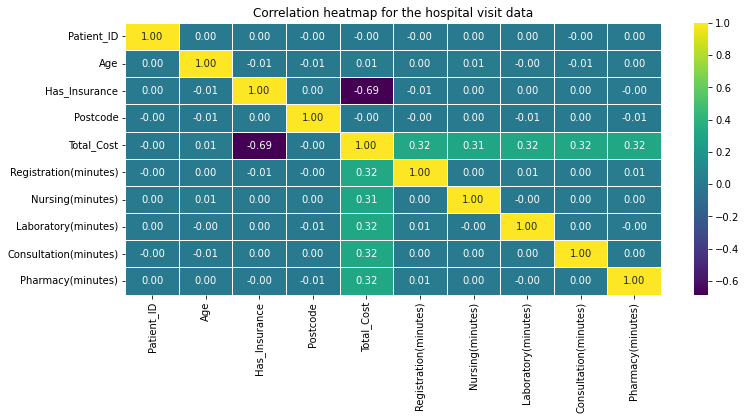
linewidths으로 선 그리기 가능
import pandas as pd
import matplotlib.pyplot as plt
df_visit = pd.read_csv('../../../delete/Demo Hospital Outpatient Data Clean_NHC.csv')
df_visit.head()| Visit_Date | Patient_ID | Age | Gender | Diagnosis | Has_Insurance | Postcode | Total_Cost | Registration(minutes) | Nursing(minutes) | Laboratory(minutes) | Consultation(minutes) | Pharmacy(minutes) | |
|---|---|---|---|---|---|---|---|---|---|---|---|---|---|
| 0 | 2020-05-06 | 688923 | 68 | Female | Diabetes | True | 20006 | 2274.0 | 33.0 | 105.0 | 101.0 | 28.0 | 112.0 |
| 1 | 2018-08-04 | 886361 | 62 | Female | Urinary Tract Infection | False | 20005 | 3430.0 | 46.0 | 75.0 | 84.0 | 102.0 | 36.0 |
| 2 | 2021-04-10 | 464823 | 70 | Female | Upper Respiratory Tract Infection | True | 10003 | 1836.0 | 107.0 | 81.0 | 5.0 | 77.0 | 36.0 |
| 3 | 2021-10-01 | 655214 | 8 | Female | Upper Respiratory Tract Infection | False | 10006 | 3250.0 | 66.0 | 31.0 | 101.0 | 35.0 | 92.0 |
| 4 | 2018-04-30 | 454666 | 24 | Male | Malaria | True | 10006 | 2262.0 | 68.0 | 55.0 | 60.0 | 90.0 | 104.0 |
avg_cost_by_gender = df_visit.groupby('Gender')['Total_Cost'].mean()
avg_cost_by_gender
Gender
Female 2632.877112
Male 2618.993034
Name: Total_Cost, dtype: float64plt.hist(df_visit['Total_Cost'], bins=20)
plt.title('Total Cost distribution')
plt.xlabel('Total Cost')
plt.ylabel("Frequency")
plt.show()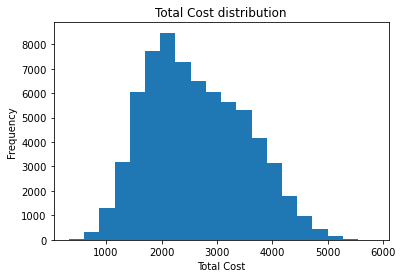
총 비용의 히스토그램은 정규분포비슷하네
avg_cost_by_insurance = df_visit[df_visit['Has_Insurance'] == True]['Total_Cost'].mean()
avg_cost_by_insurance1876.0660470202297avg_cost_without_insurance = df_visit[df_visit['Has_Insurance'] == False]['Total_Cost'].mean()
avg_cost_without_insurance3125.477213683929평균비용은 다음과 같음
df_visit['Visit_Date'] = pd.to_datetime(df_visit['Visit_Date'])
df_visit.set_index("Visit_Date", inplace=True)
annual_total_cost = df_visit['Total_Cost'].resample("Y").sum()plt.figure(figsize=(12,6))
plt.plot(annual_total_cost.index, annual_total_cost.values)
plt.title("Annual Total Cost over Time")
plt.xlabel("Year")
plt.ylabel("Total Cost")
plt.grid(True)
plt.show()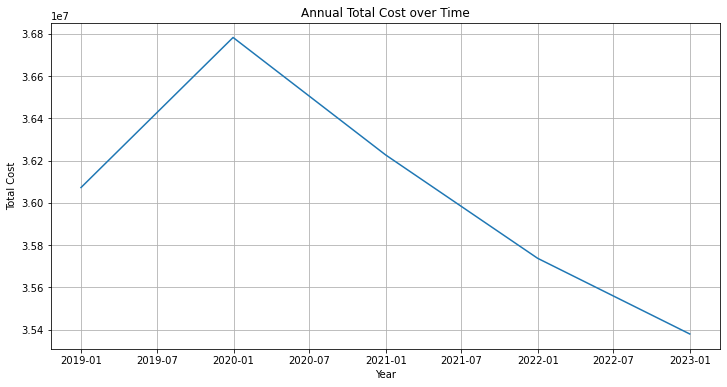
df_visit = df_visit.reset_index()df_visit.set_index('Visit_Date', inplace=True)
df_visit.head()| Patient_ID | Age | Gender | Diagnosis | Has_Insurance | Postcode | Total_Cost | Registration(minutes) | Nursing(minutes) | Laboratory(minutes) | Consultation(minutes) | Pharmacy(minutes) | |
|---|---|---|---|---|---|---|---|---|---|---|---|---|
| Visit_Date | ||||||||||||
| 2020-05-06 | 688923 | 68 | Female | Diabetes | True | 20006 | 2274.0 | 33.0 | 105.0 | 101.0 | 28.0 | 112.0 |
| 2018-08-04 | 886361 | 62 | Female | Urinary Tract Infection | False | 20005 | 3430.0 | 46.0 | 75.0 | 84.0 | 102.0 | 36.0 |
| 2021-04-10 | 464823 | 70 | Female | Upper Respiratory Tract Infection | True | 10003 | 1836.0 | 107.0 | 81.0 | 5.0 | 77.0 | 36.0 |
| 2021-10-01 | 655214 | 8 | Female | Upper Respiratory Tract Infection | False | 10006 | 3250.0 | 66.0 | 31.0 | 101.0 | 35.0 | 92.0 |
| 2018-04-30 | 454666 | 24 | Male | Malaria | True | 10006 | 2262.0 | 68.0 | 55.0 | 60.0 | 90.0 | 104.0 |
has_insurance_true_data = df_visit[df_visit['Has_Insurance'] == True]['Total_Cost'].resample('Y').sum()
has_insurance_false_data = df_visit[df_visit['Has_Insurance'] == False]['Total_Cost'].resample('Y').sum()plt.figure(figsize=(12,6))
plt.plot(has_insurance_true_data.index, has_insurance_true_data.values,label='Has Insurance: True')
plt.plot(has_insurance_false_data.index, has_insurance_false_data.values,label='Has Insurance: False')
plt.title('Annual Total Cost by Insurance Status')
plt.xlabel('Year')
plt.ylabel('Total Cost')
plt.grid(True)
plt.legend()
plt.show()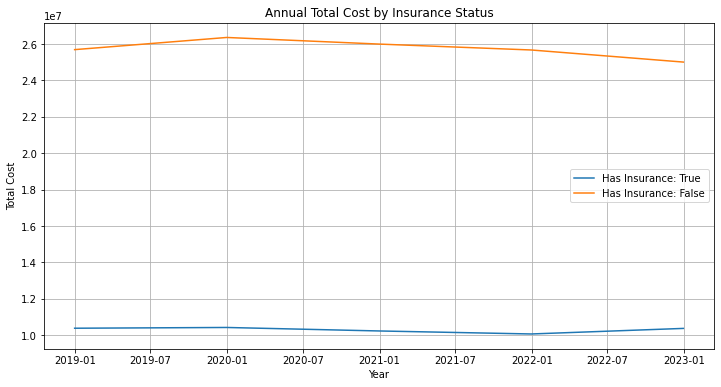
보험 현황을 보면 보험을 가지고 있는 사람들이 낮아지는 경향을 보이는 구간이 있는데 이 구간을 자세히 봐야하며 결정 권한은 경영권자에게 있어서 통계학자나 데이터 분석가들은 이 사실만 알리면 된다.