intro
ggplot2 공부하다가 포기함
그냥 ggplot2를 랩핑하여 내 스타일에 맞는 코드를 새로 만듬 (가칭 ggplot3)
── Attaching core tidyverse packages ──────────────────────── tidyverse 2.0.0 ──
✔ dplyr     1.1.2     ✔ readr     2.1.4
✔ forcats   1.0.0     ✔ stringr   1.5.0
✔ ggplot2   3.4.2     ✔ tibble    3.2.1
✔ lubridate 1.9.2     ✔ tidyr     1.3.0
✔ purrr     1.0.1
── Conflicts ────────────────────────────────────────── tidyverse_conflicts() ──
✖ dplyr::filter() masks stats::filter()
✖ dplyr::lag()    masks stats::lag()
ℹ Use the conflicted package (<http://conflicted.r-lib.org/>) to force all conflicts to become errors
소스코드 다운로드: https://github.com/miruetoto/yechan3/blob/main/posts/1_Essays/ggplot3.R
figsize
주피터 환경에서 그림의 크기를 조정하는 함수로 figsize() 구현, Rstudio에서는 그림크기가 유연하게 조정가능하므로 필요없음.
- 기본플랏
- 크기조정 (원래는 ggplot 이미지를 주피터에서 조정하려고 만들었는데, 기본플랏도 조정됨)
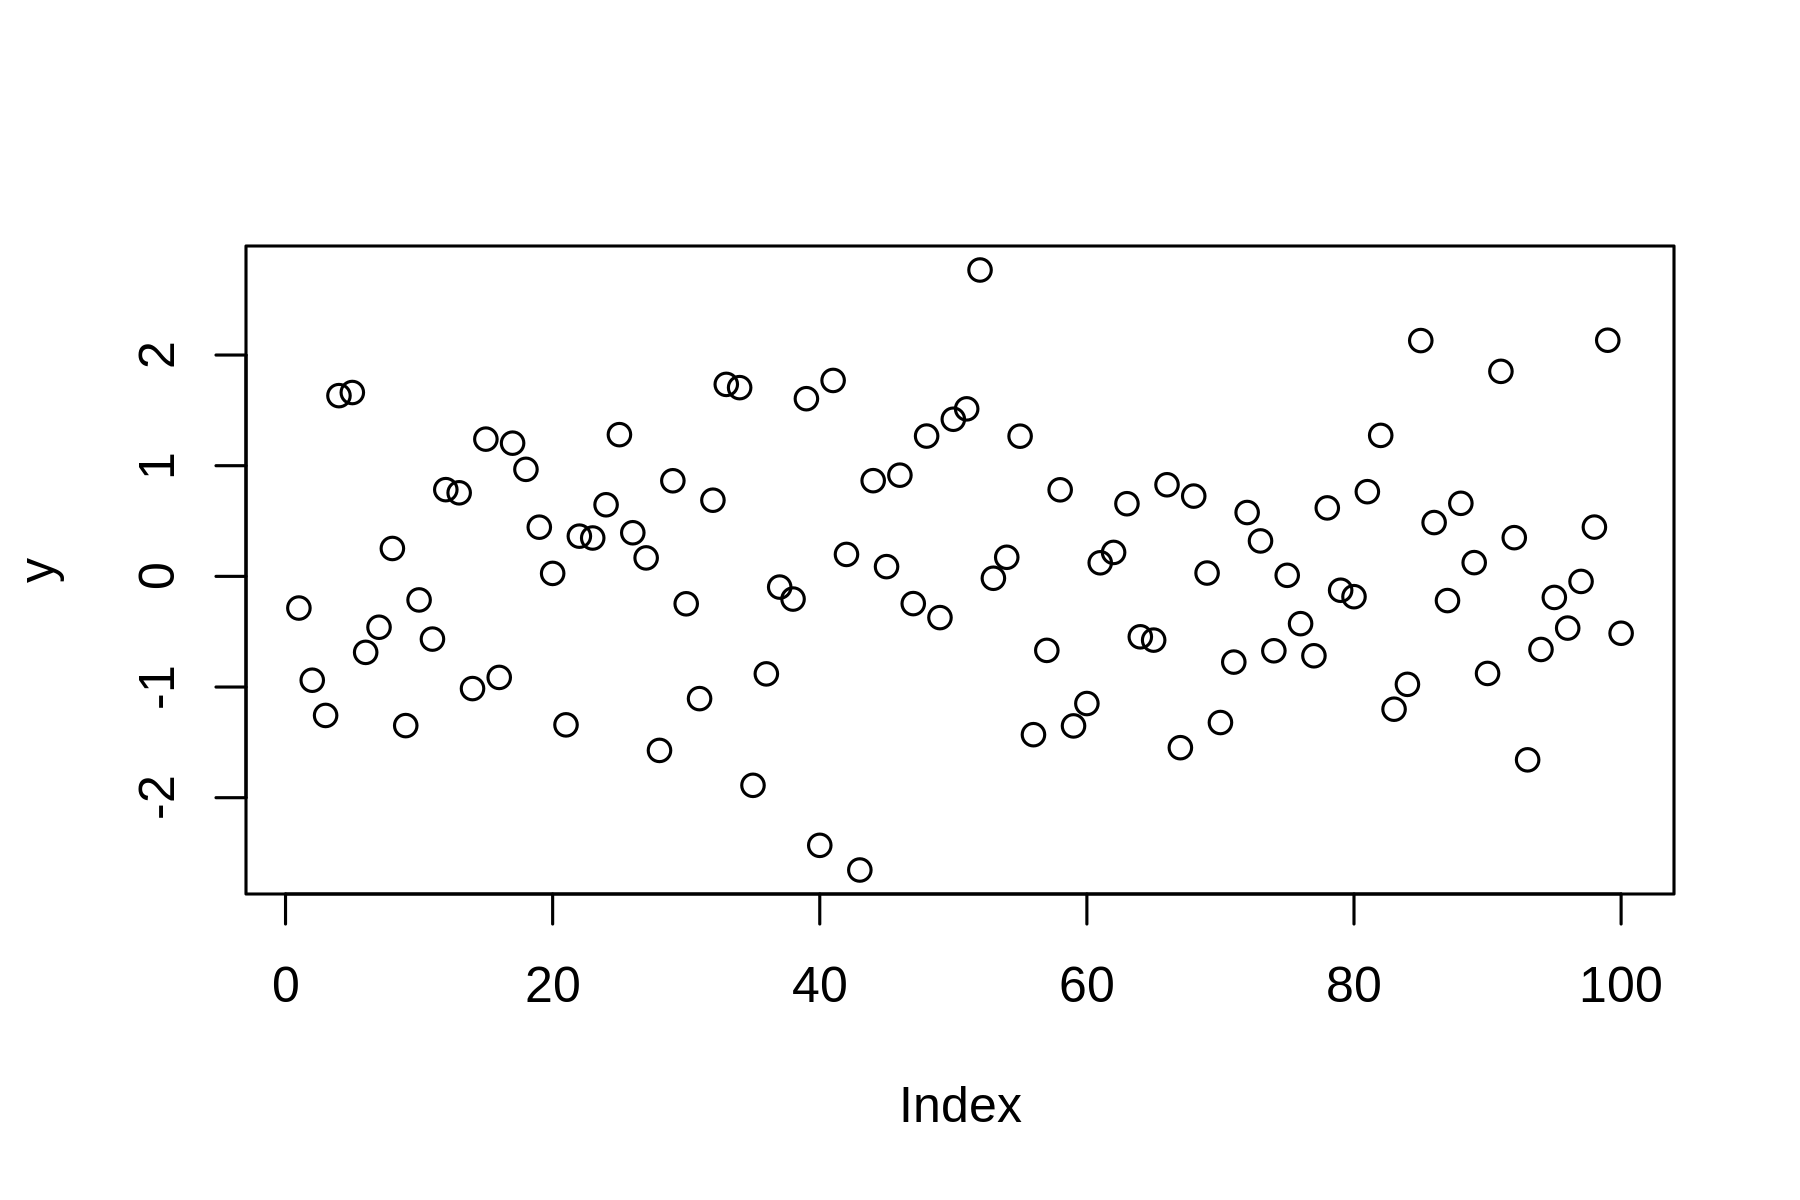
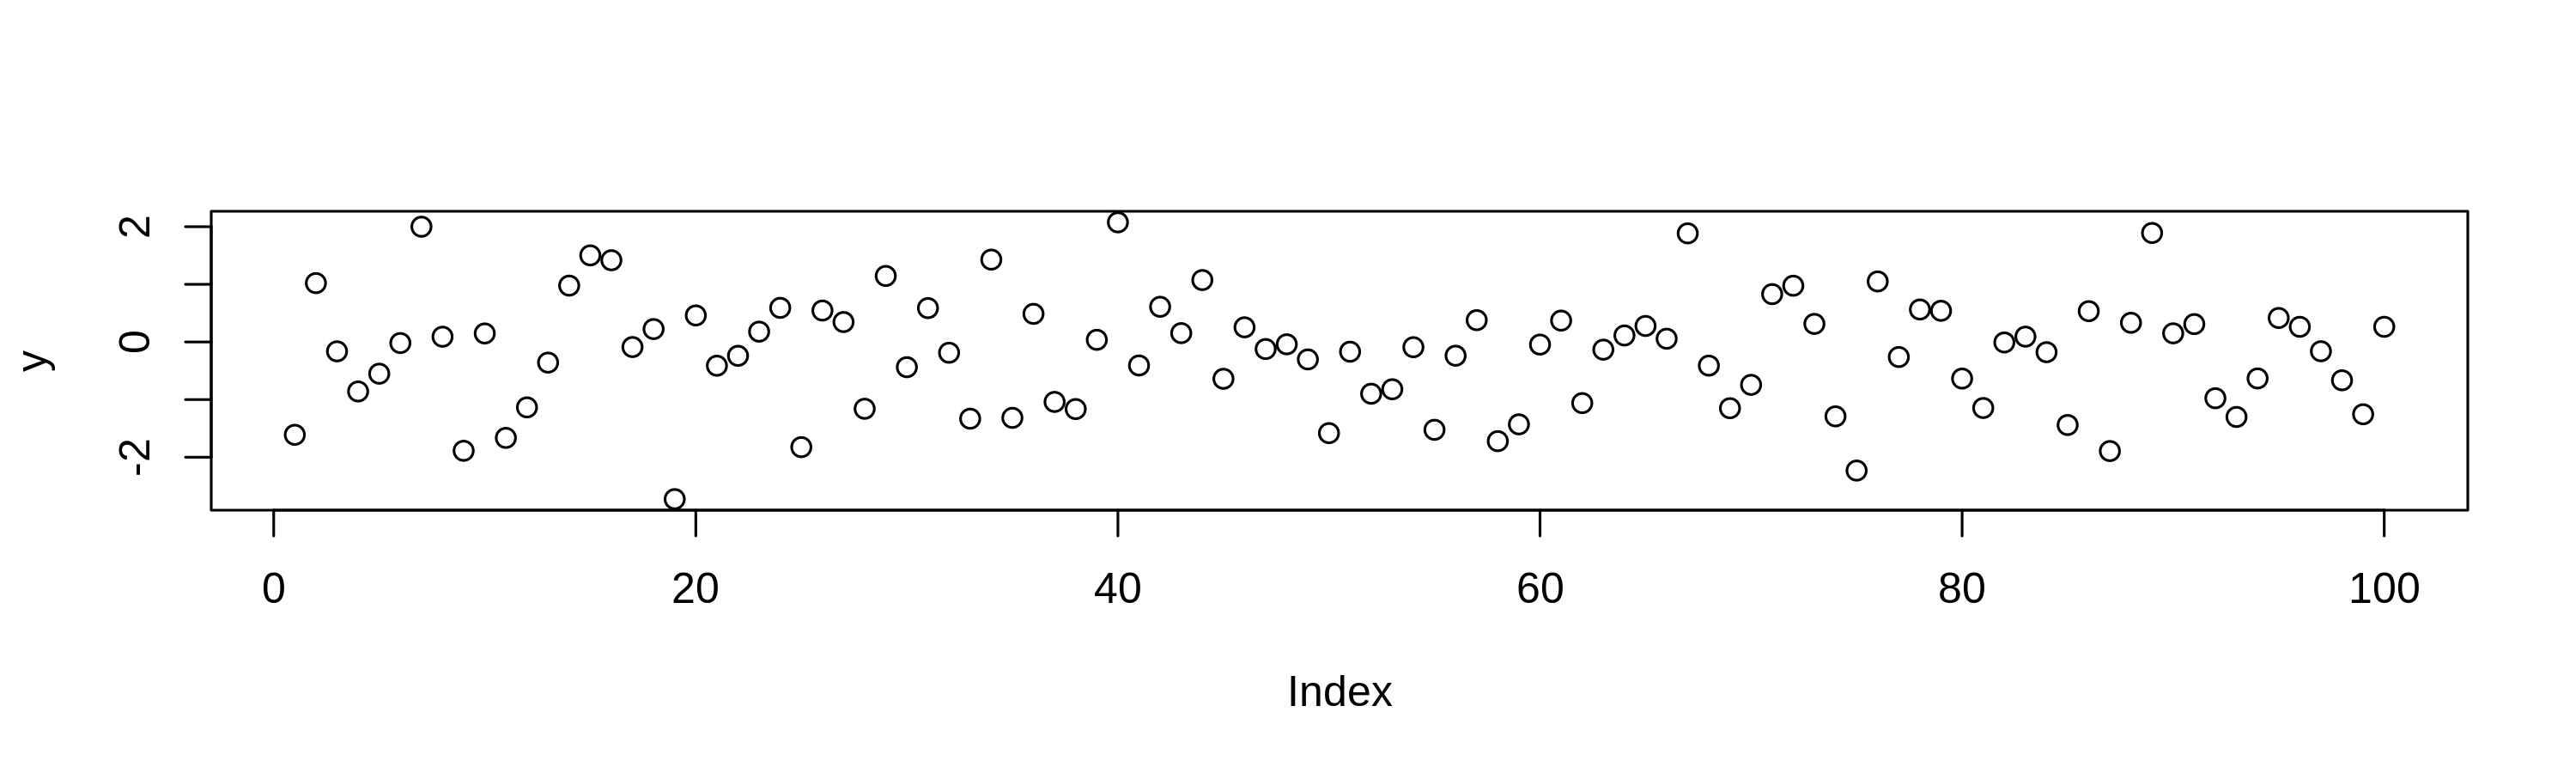
y = rnorm(100)
figsize(10,3) # 디폴트는 6,4
plot(y)
figsize()
기본적인 사용법 소개
ggplot + line + point
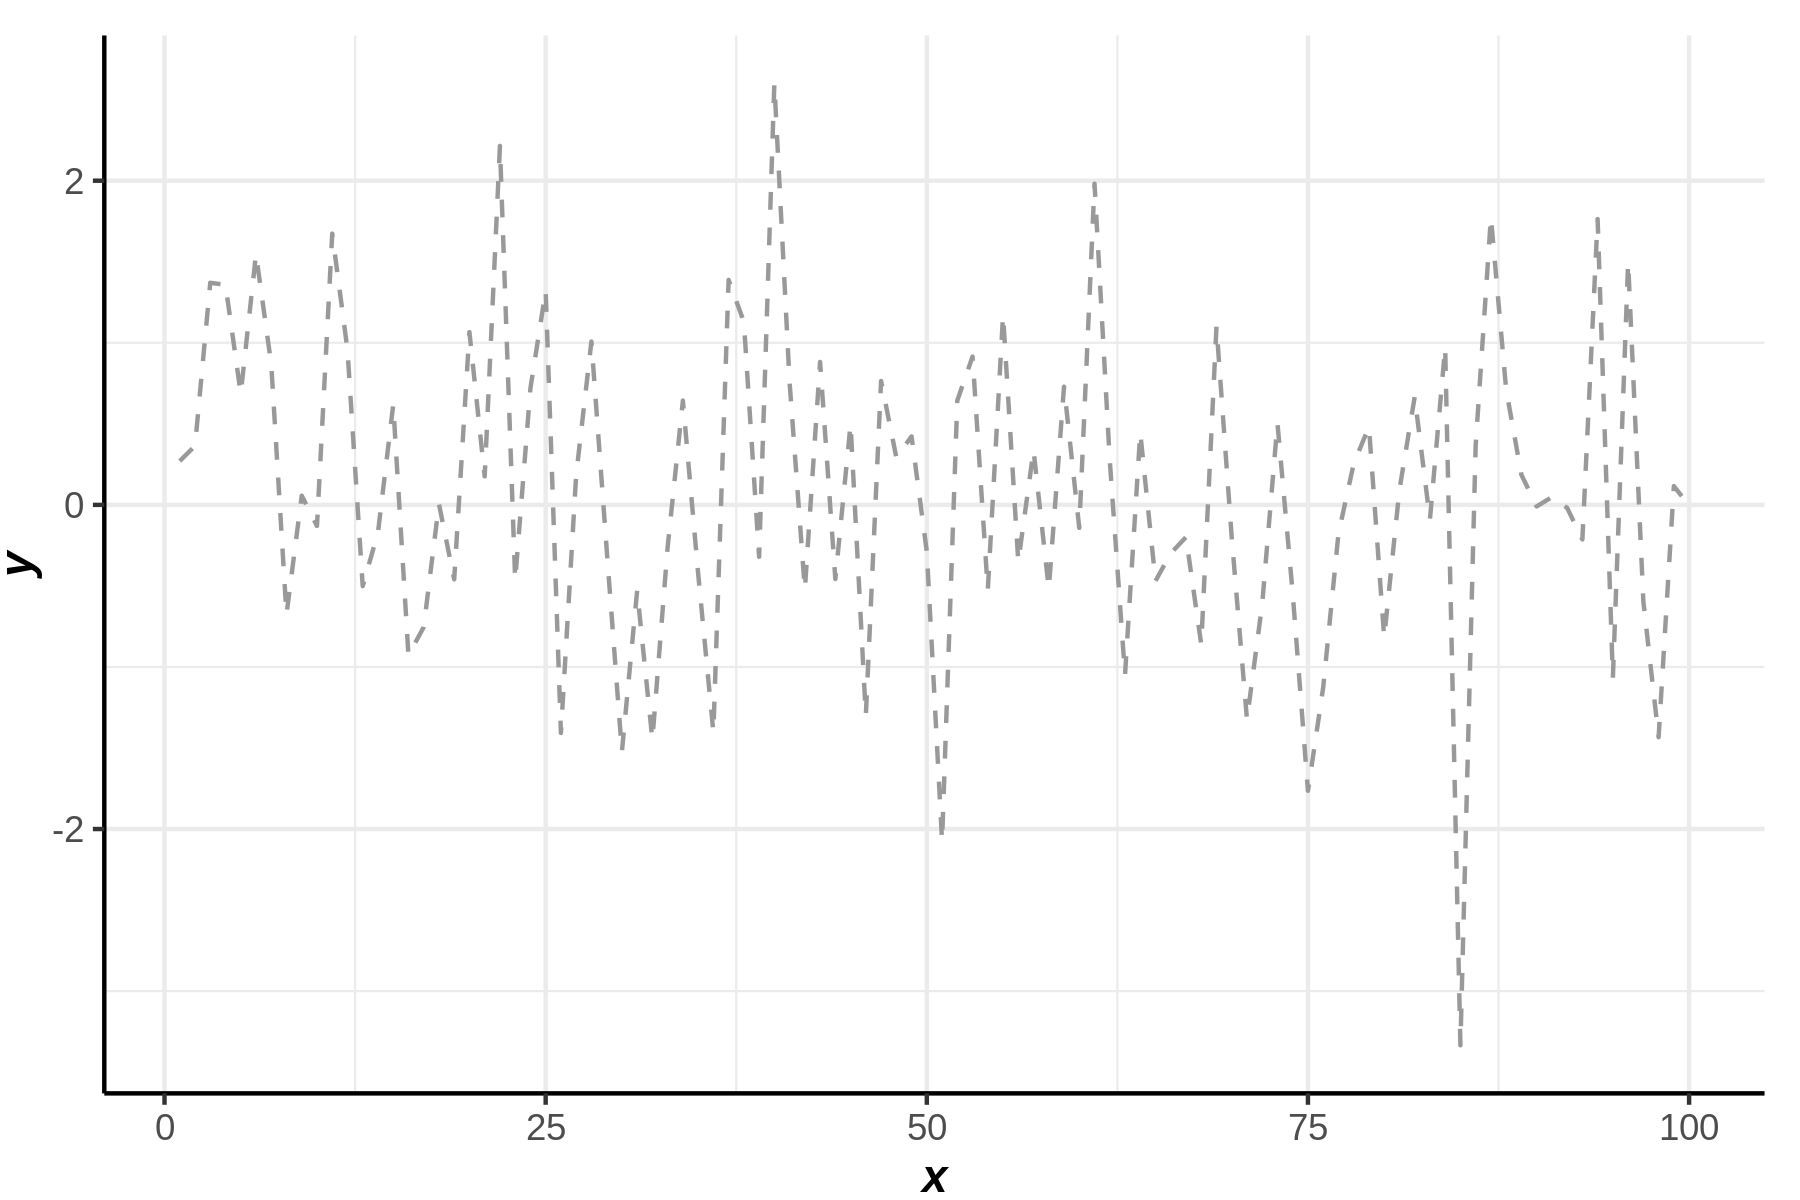
- 예시1
ggplot() + line(1:100, y, lty=2, col='gray60')
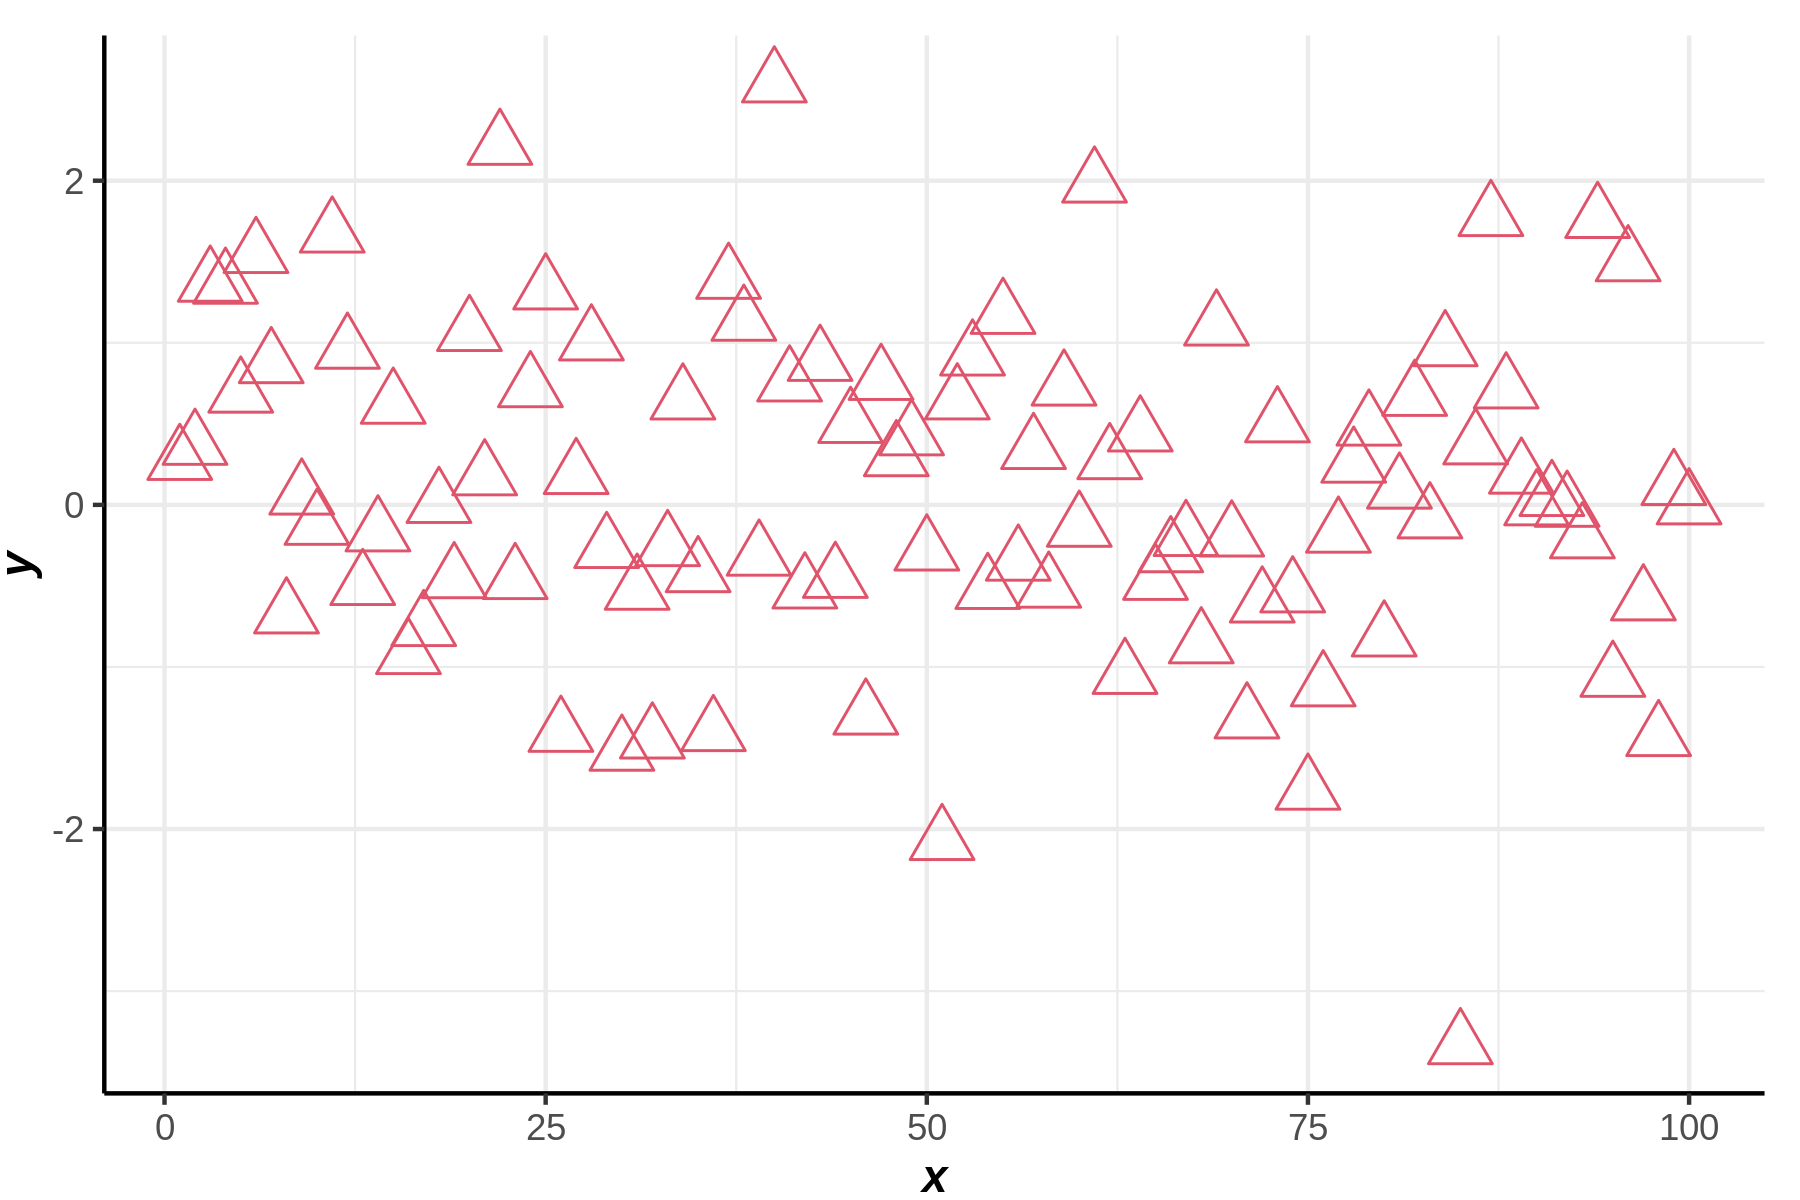
- 예시2
ggplot() + point(y,pch=2,col=2,cex=5)
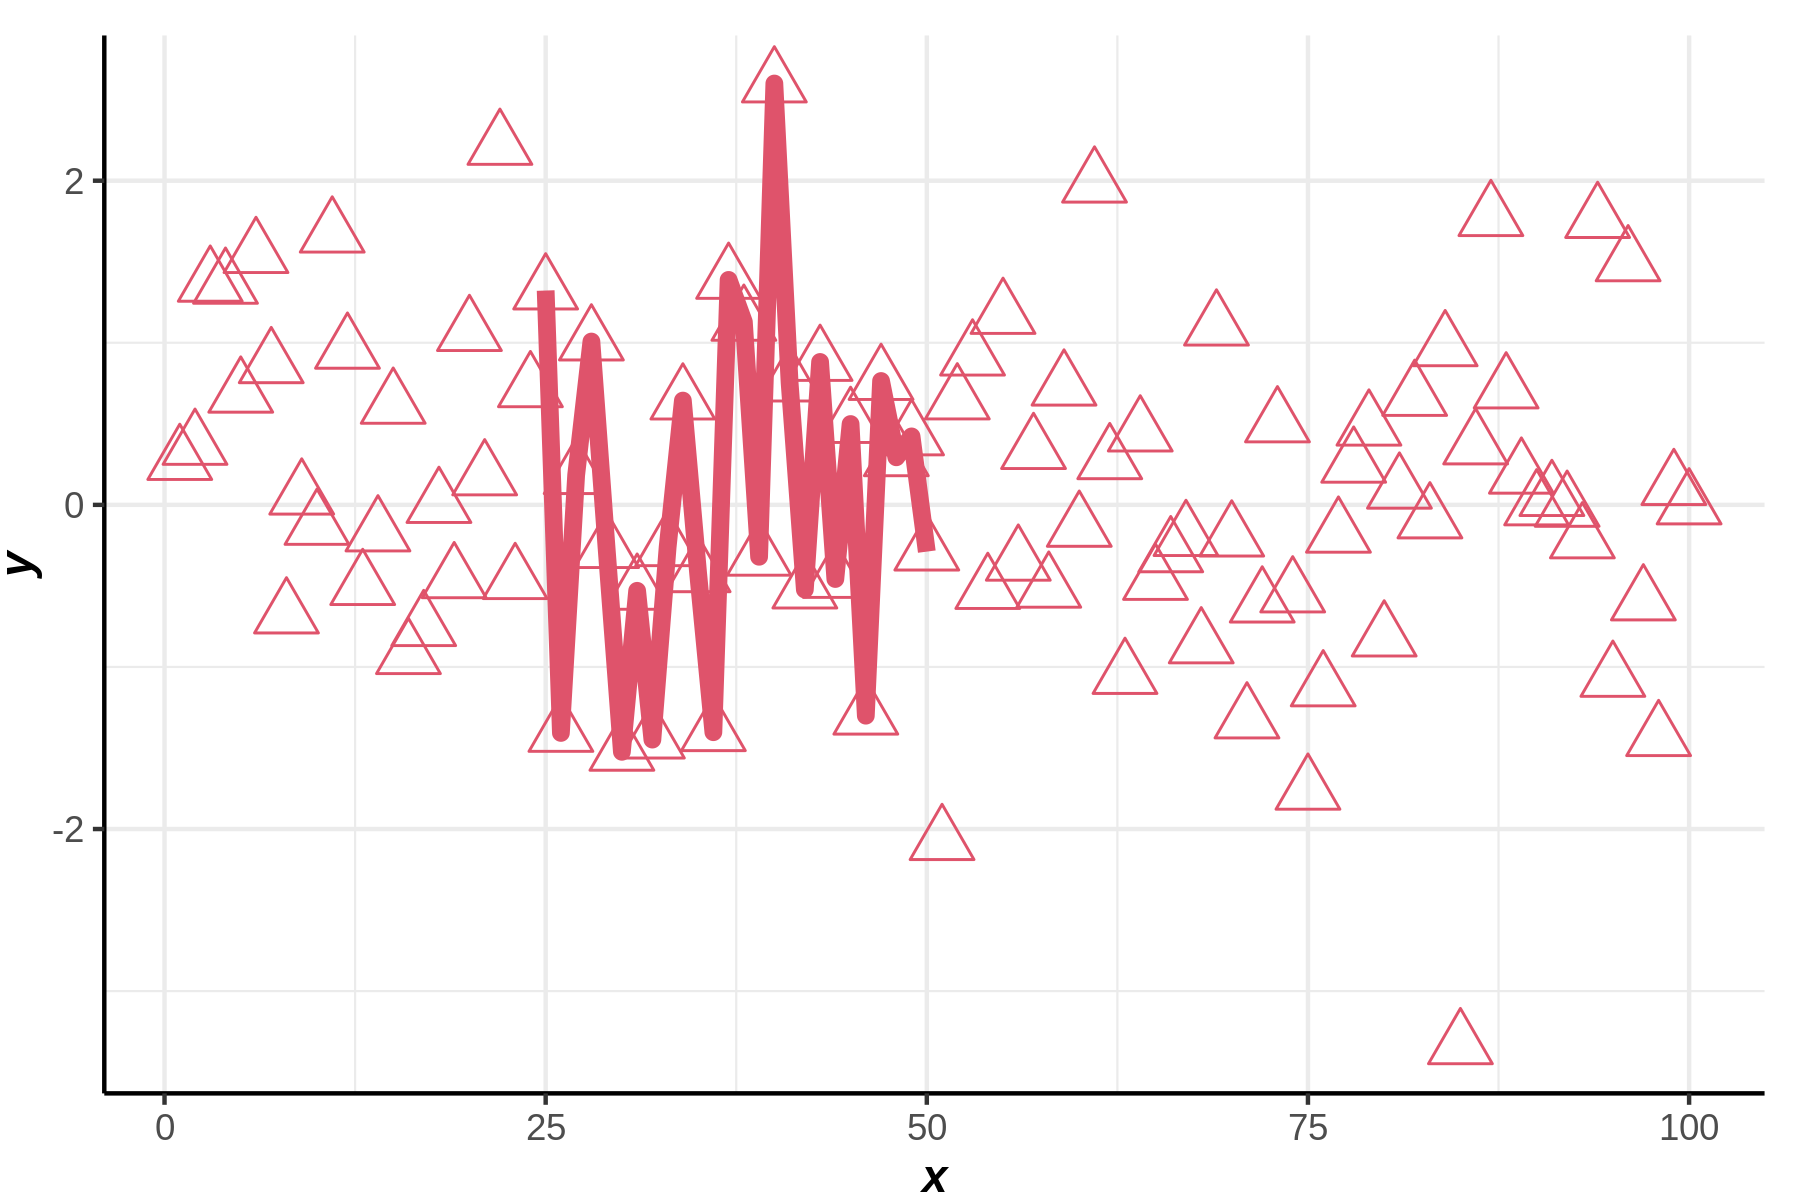
- 예시3
ggplot() + point(y,pch=2,col=2,cex=5) + line(25:50, y[25:50], col=2, lwd=2)
ggplot2와 호환
df = data.frame(x=1:100,y=rnorm(100))
head(df)
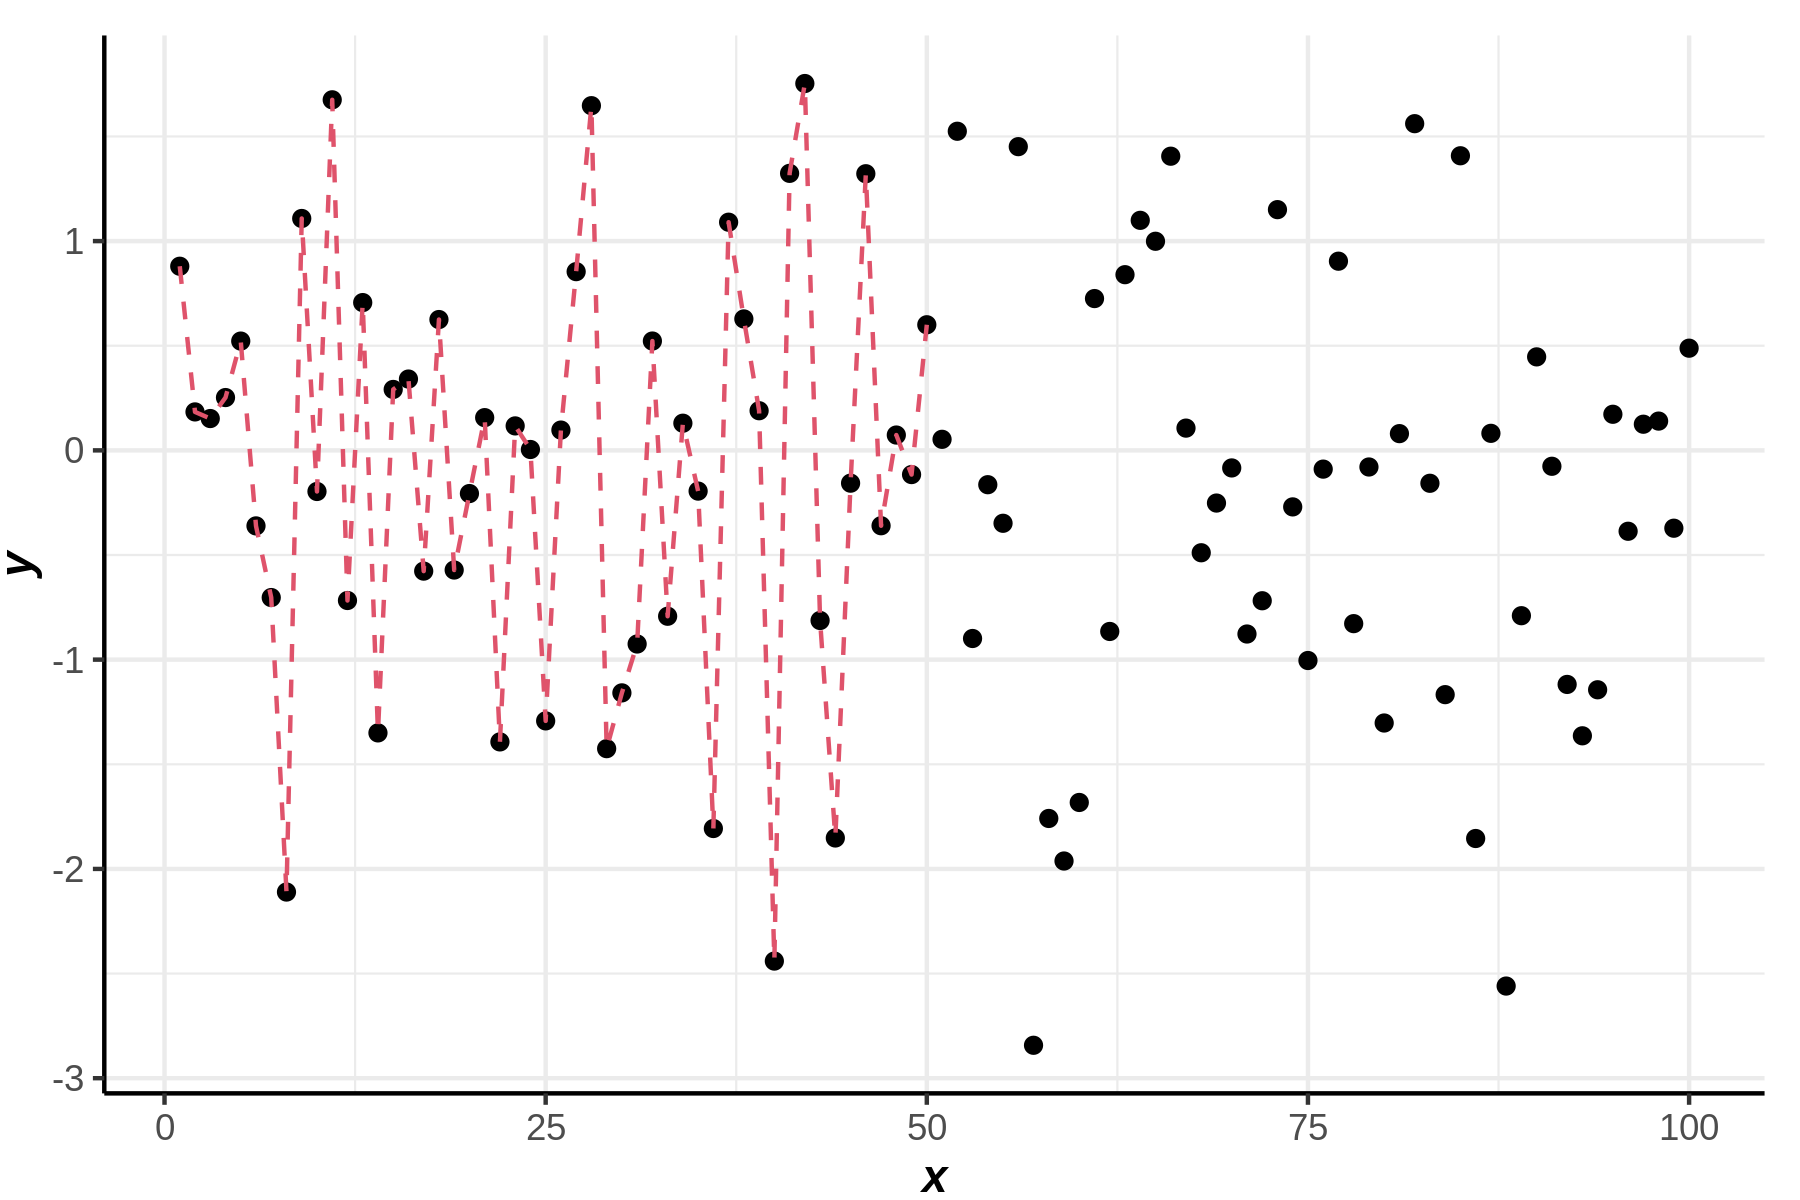
ggplot(data=df) +
geom_point(aes(x=x,y=y)) +
line(1:50,df$y[1:50],col=2,lty=2)
완벽하게 호환가능
subplotting
y = rnorm(100)
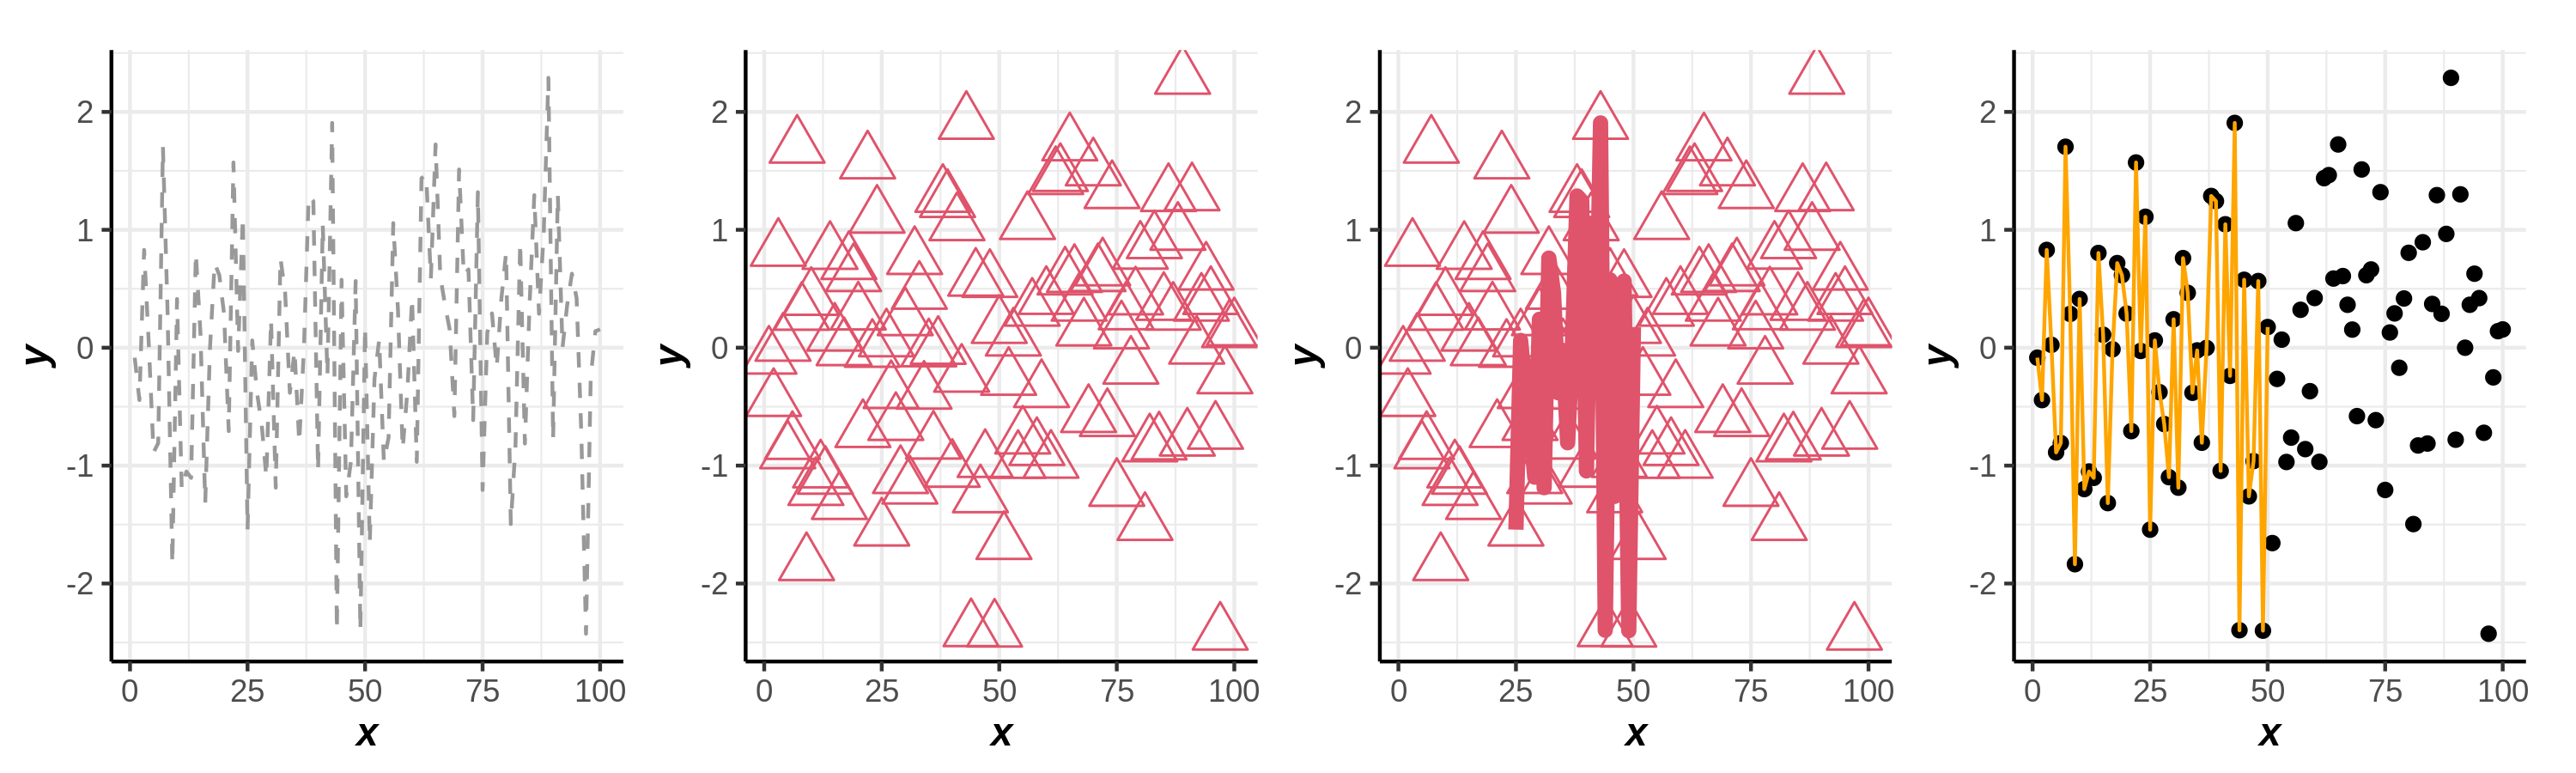
p1 = ggplot() + line(y,lty=2,col='gray60')
p2 = ggplot() + point(y,pch=2,col=2,cex=5)
p3 = ggplot() + point(y,pch=2,col=2,cex=5) + line(25:50, y[25:50], col=2, lwd=2)
p4 = ggplot() + point(y) + line(1:50,y[1:50],col='orange')
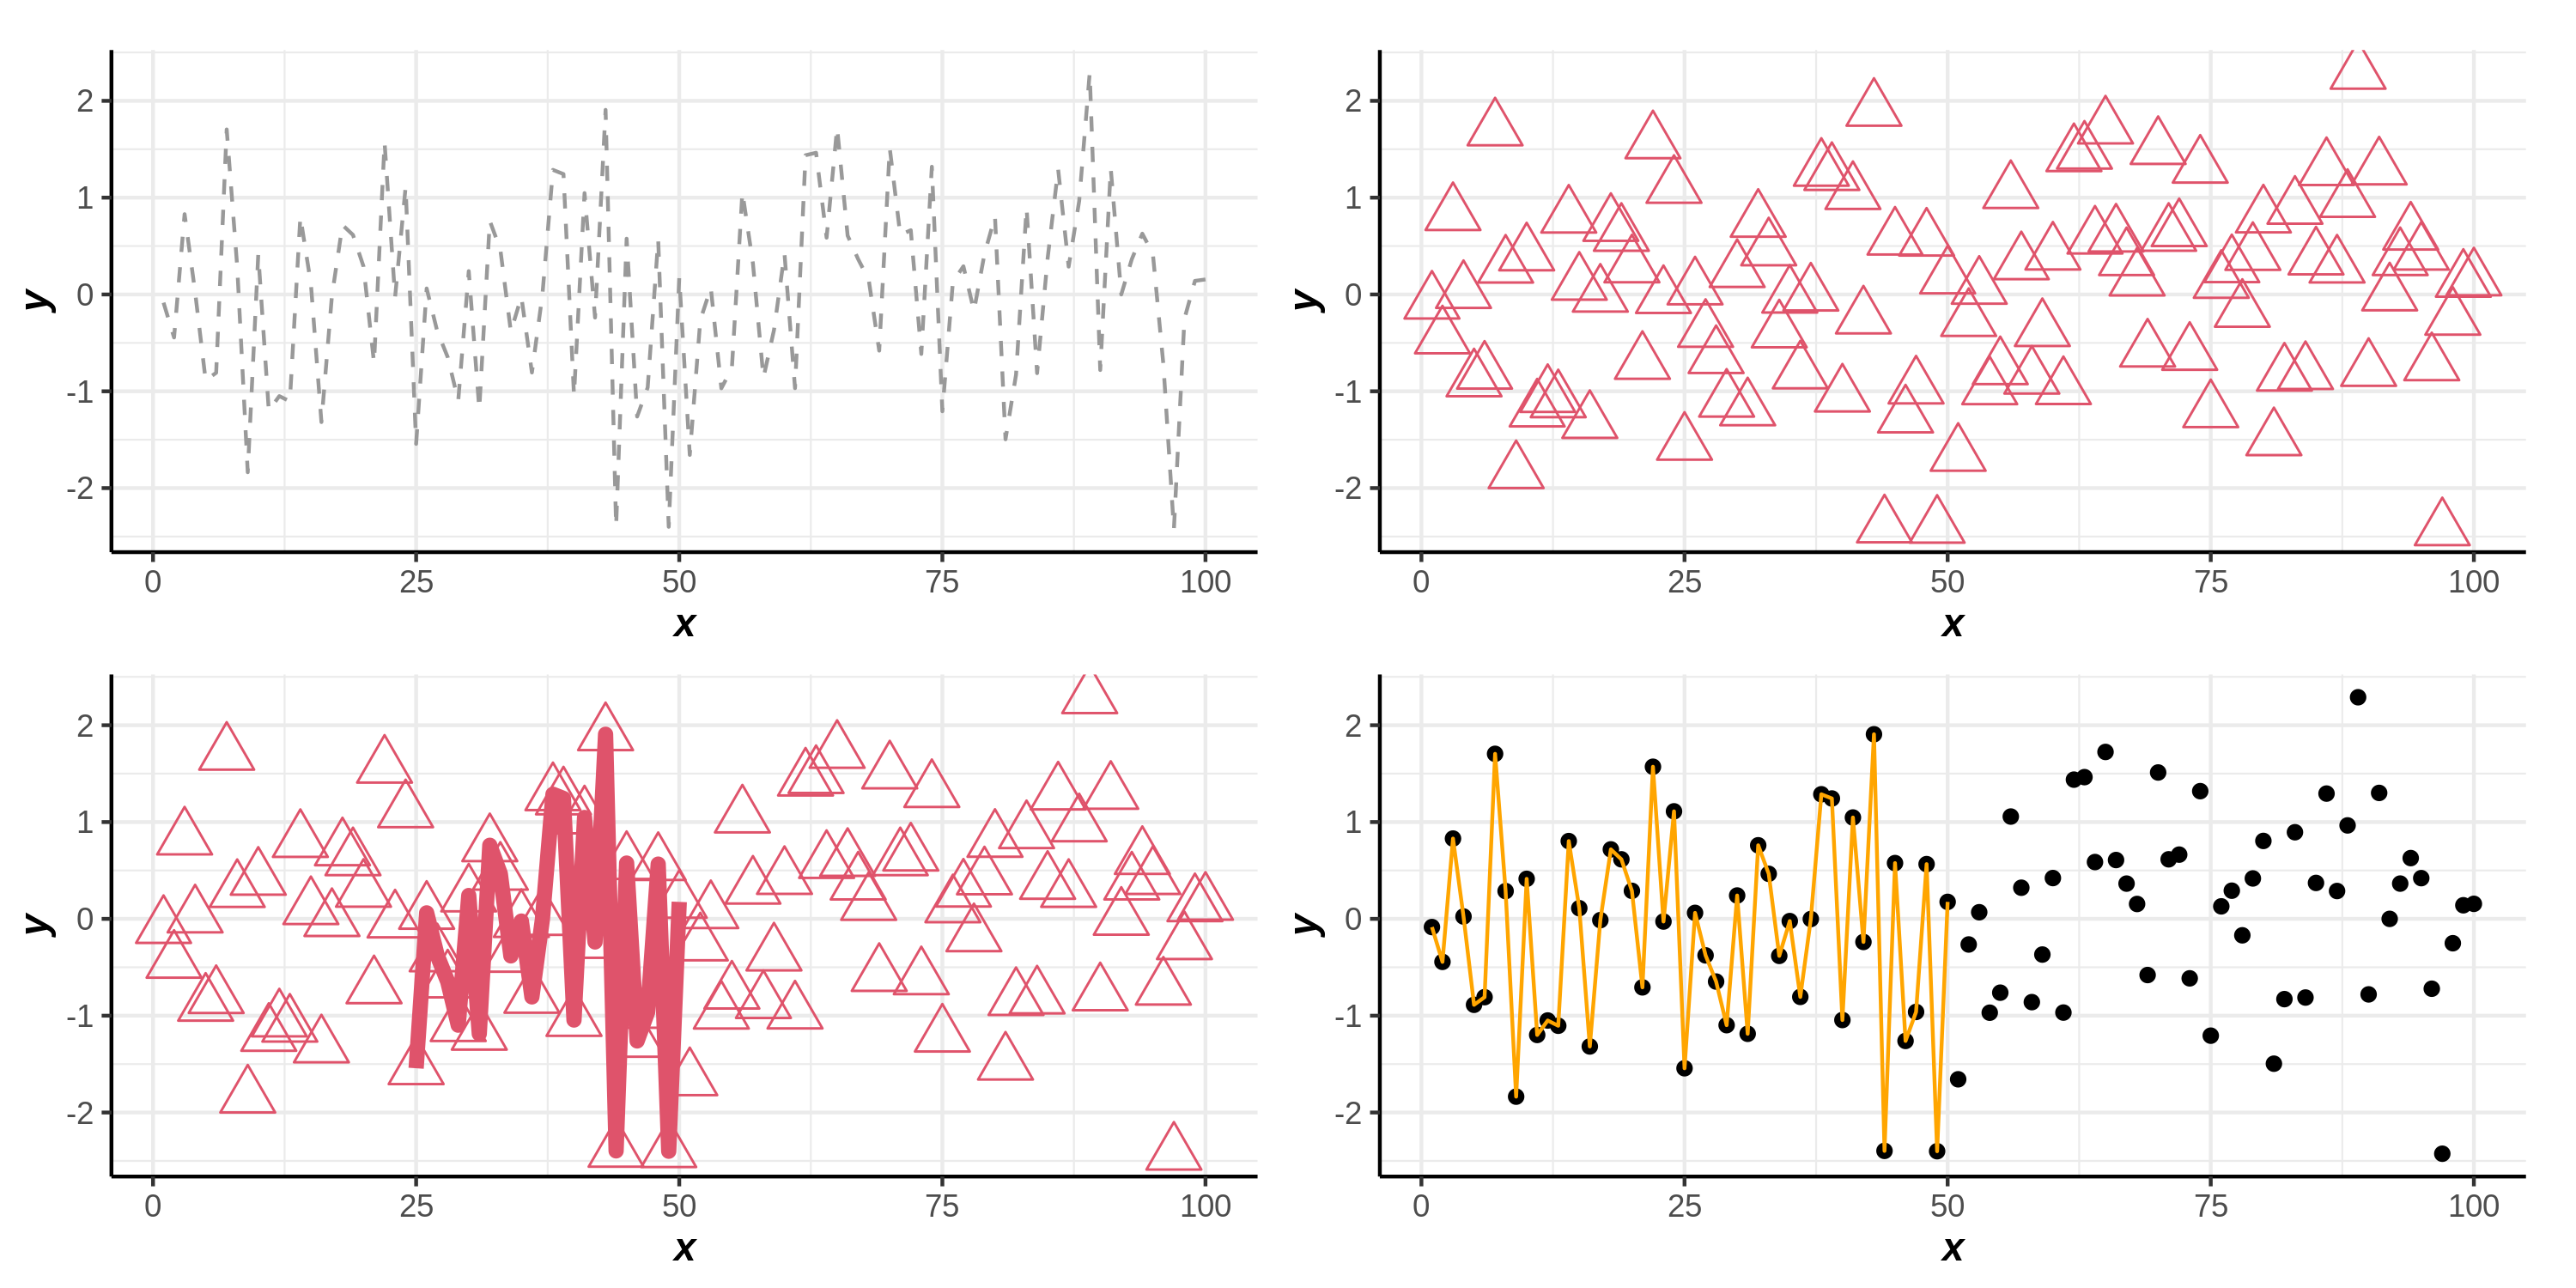
- 예시1: 좌우로 나란히
figsize(10,3)
p1|p2|p3|p4
figsize()
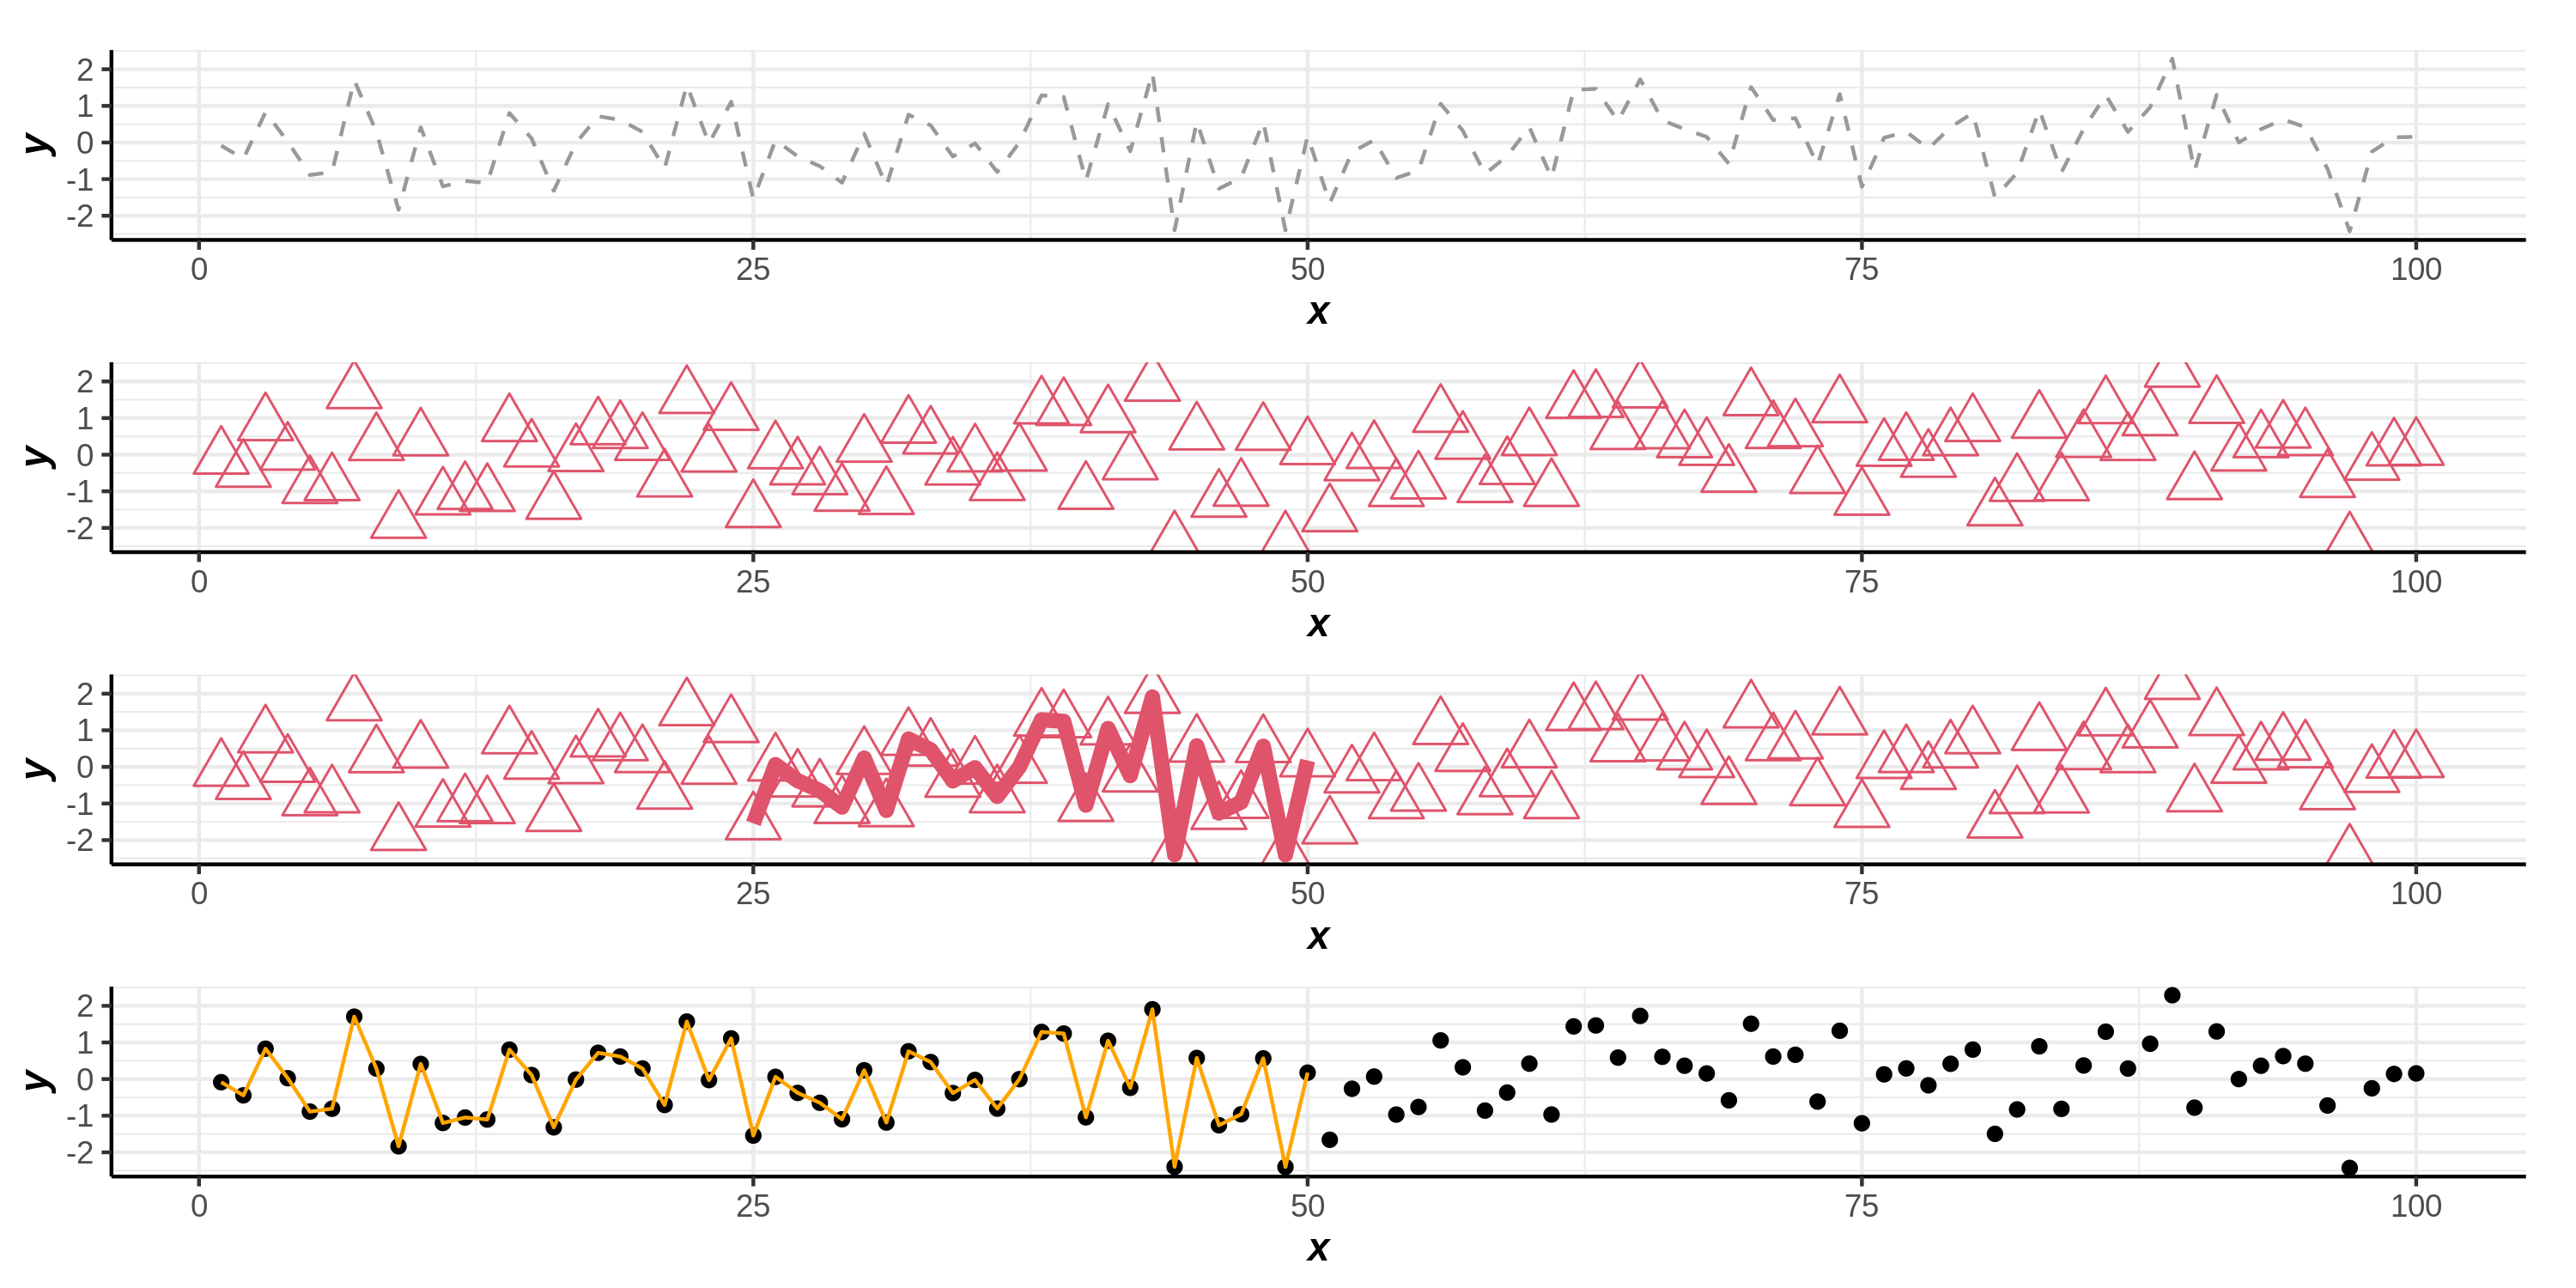
- 예시2: 위아래로
figsize(10,5)
p1/p2/p3/p4
figsize()
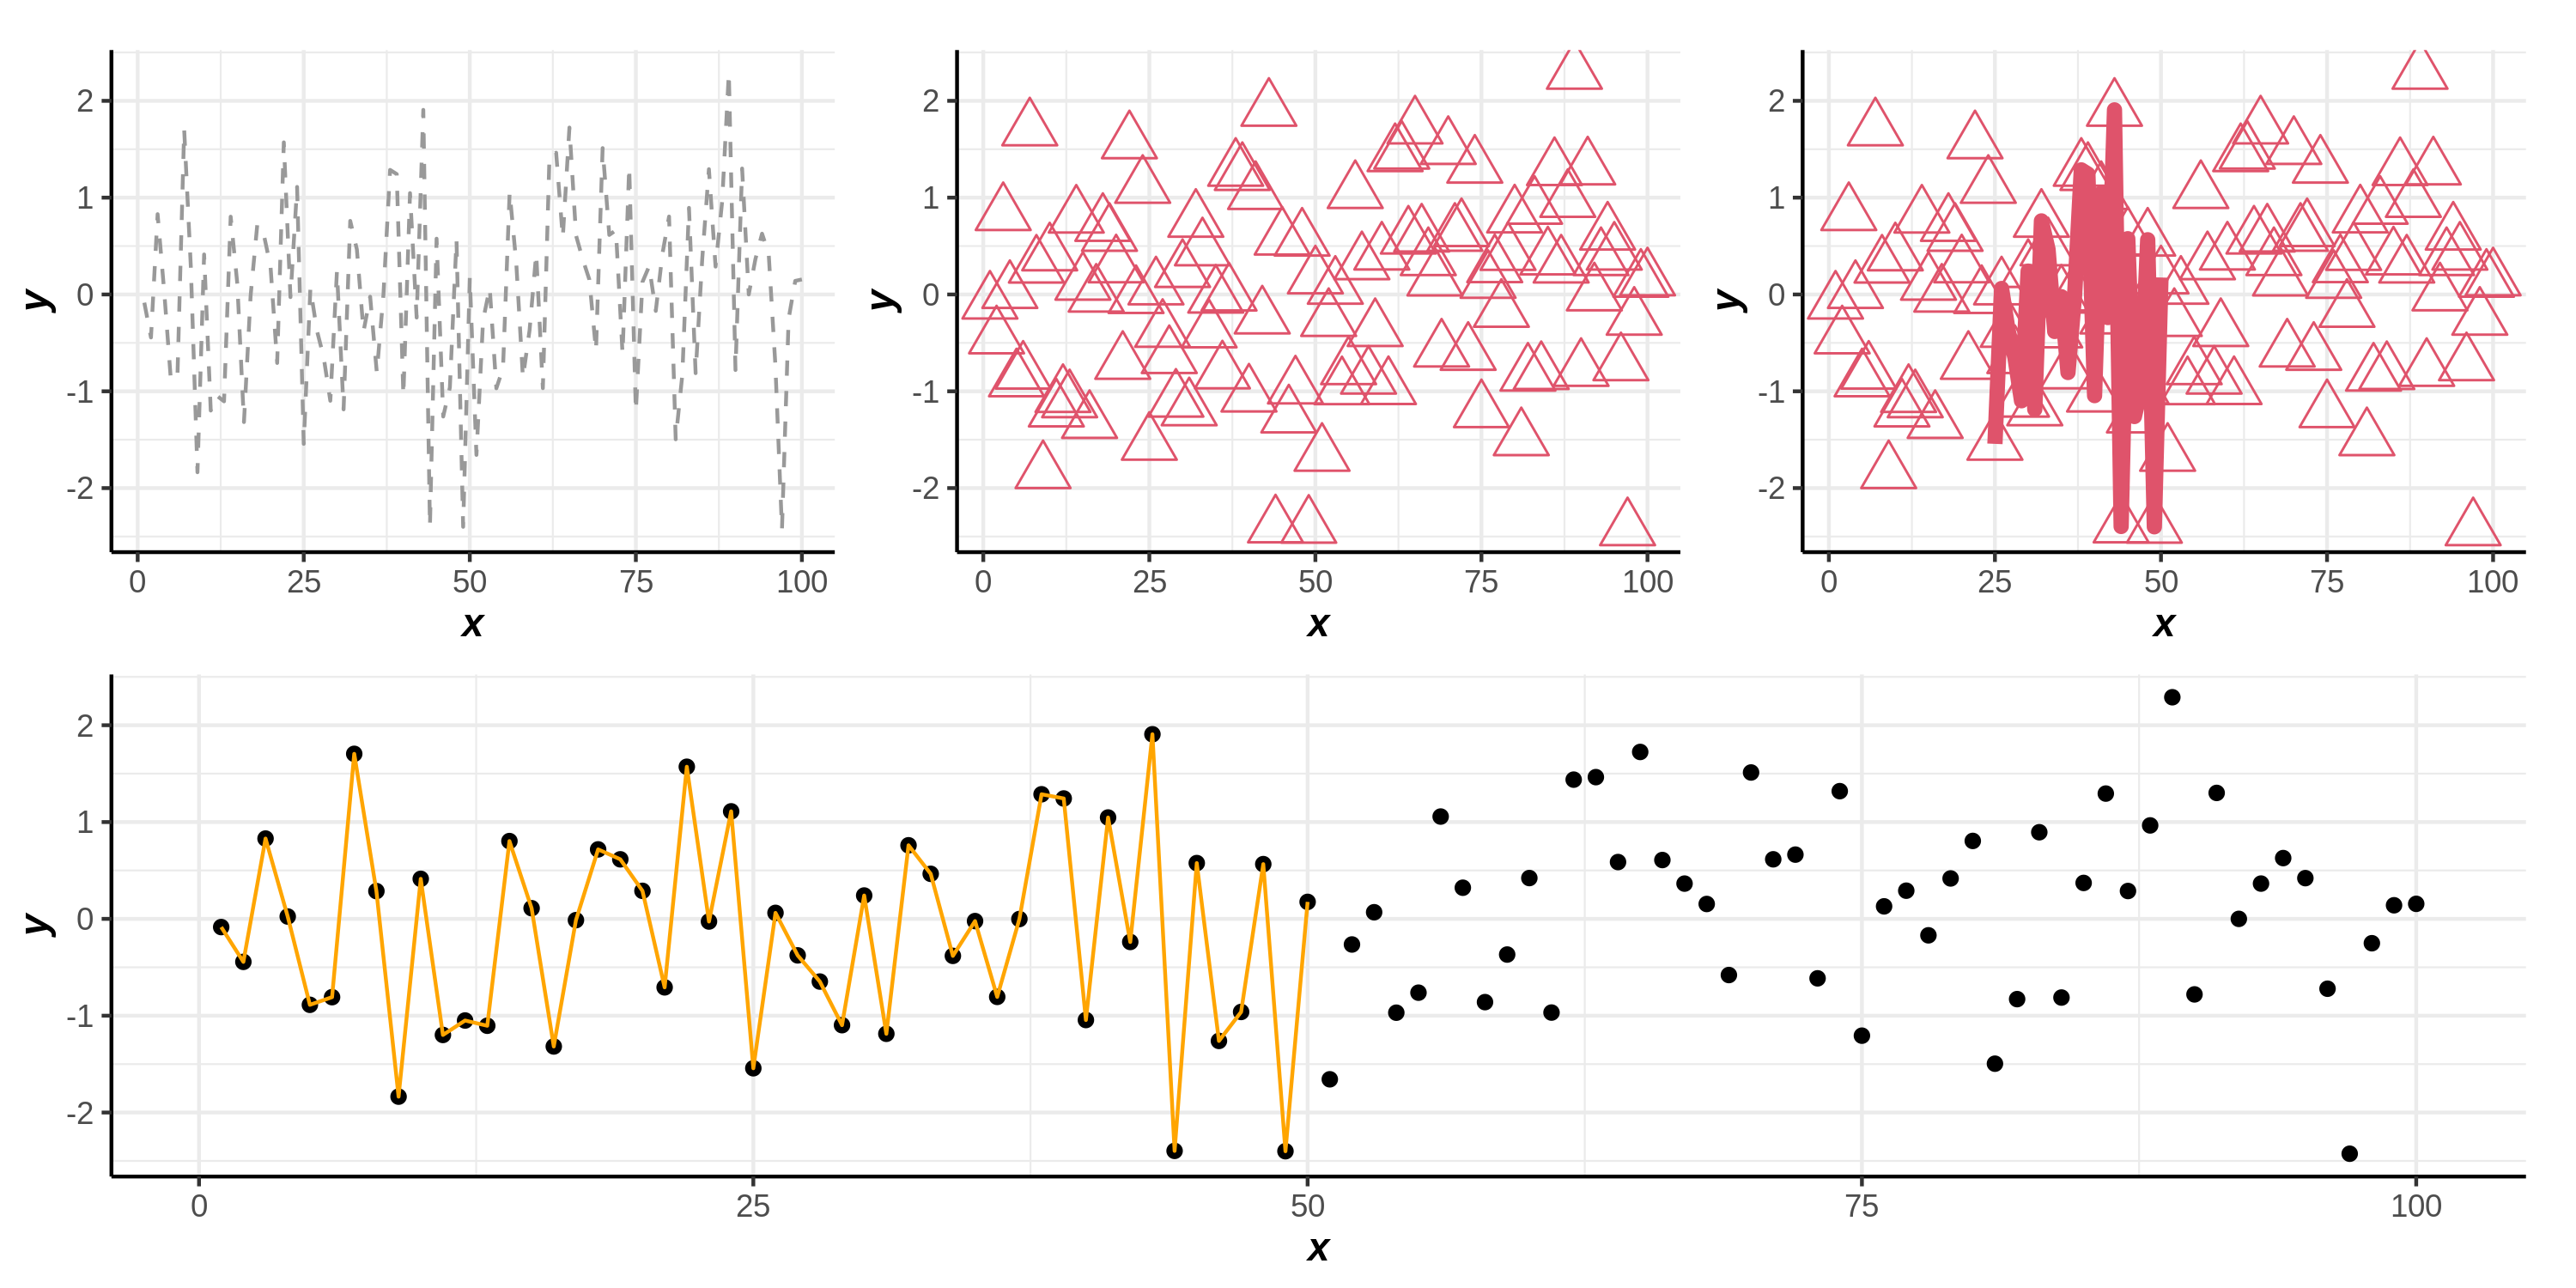
- 예시3: 그리드로!
figsize(10,5)
(p1|p2)/(p3|p4)
figsize()
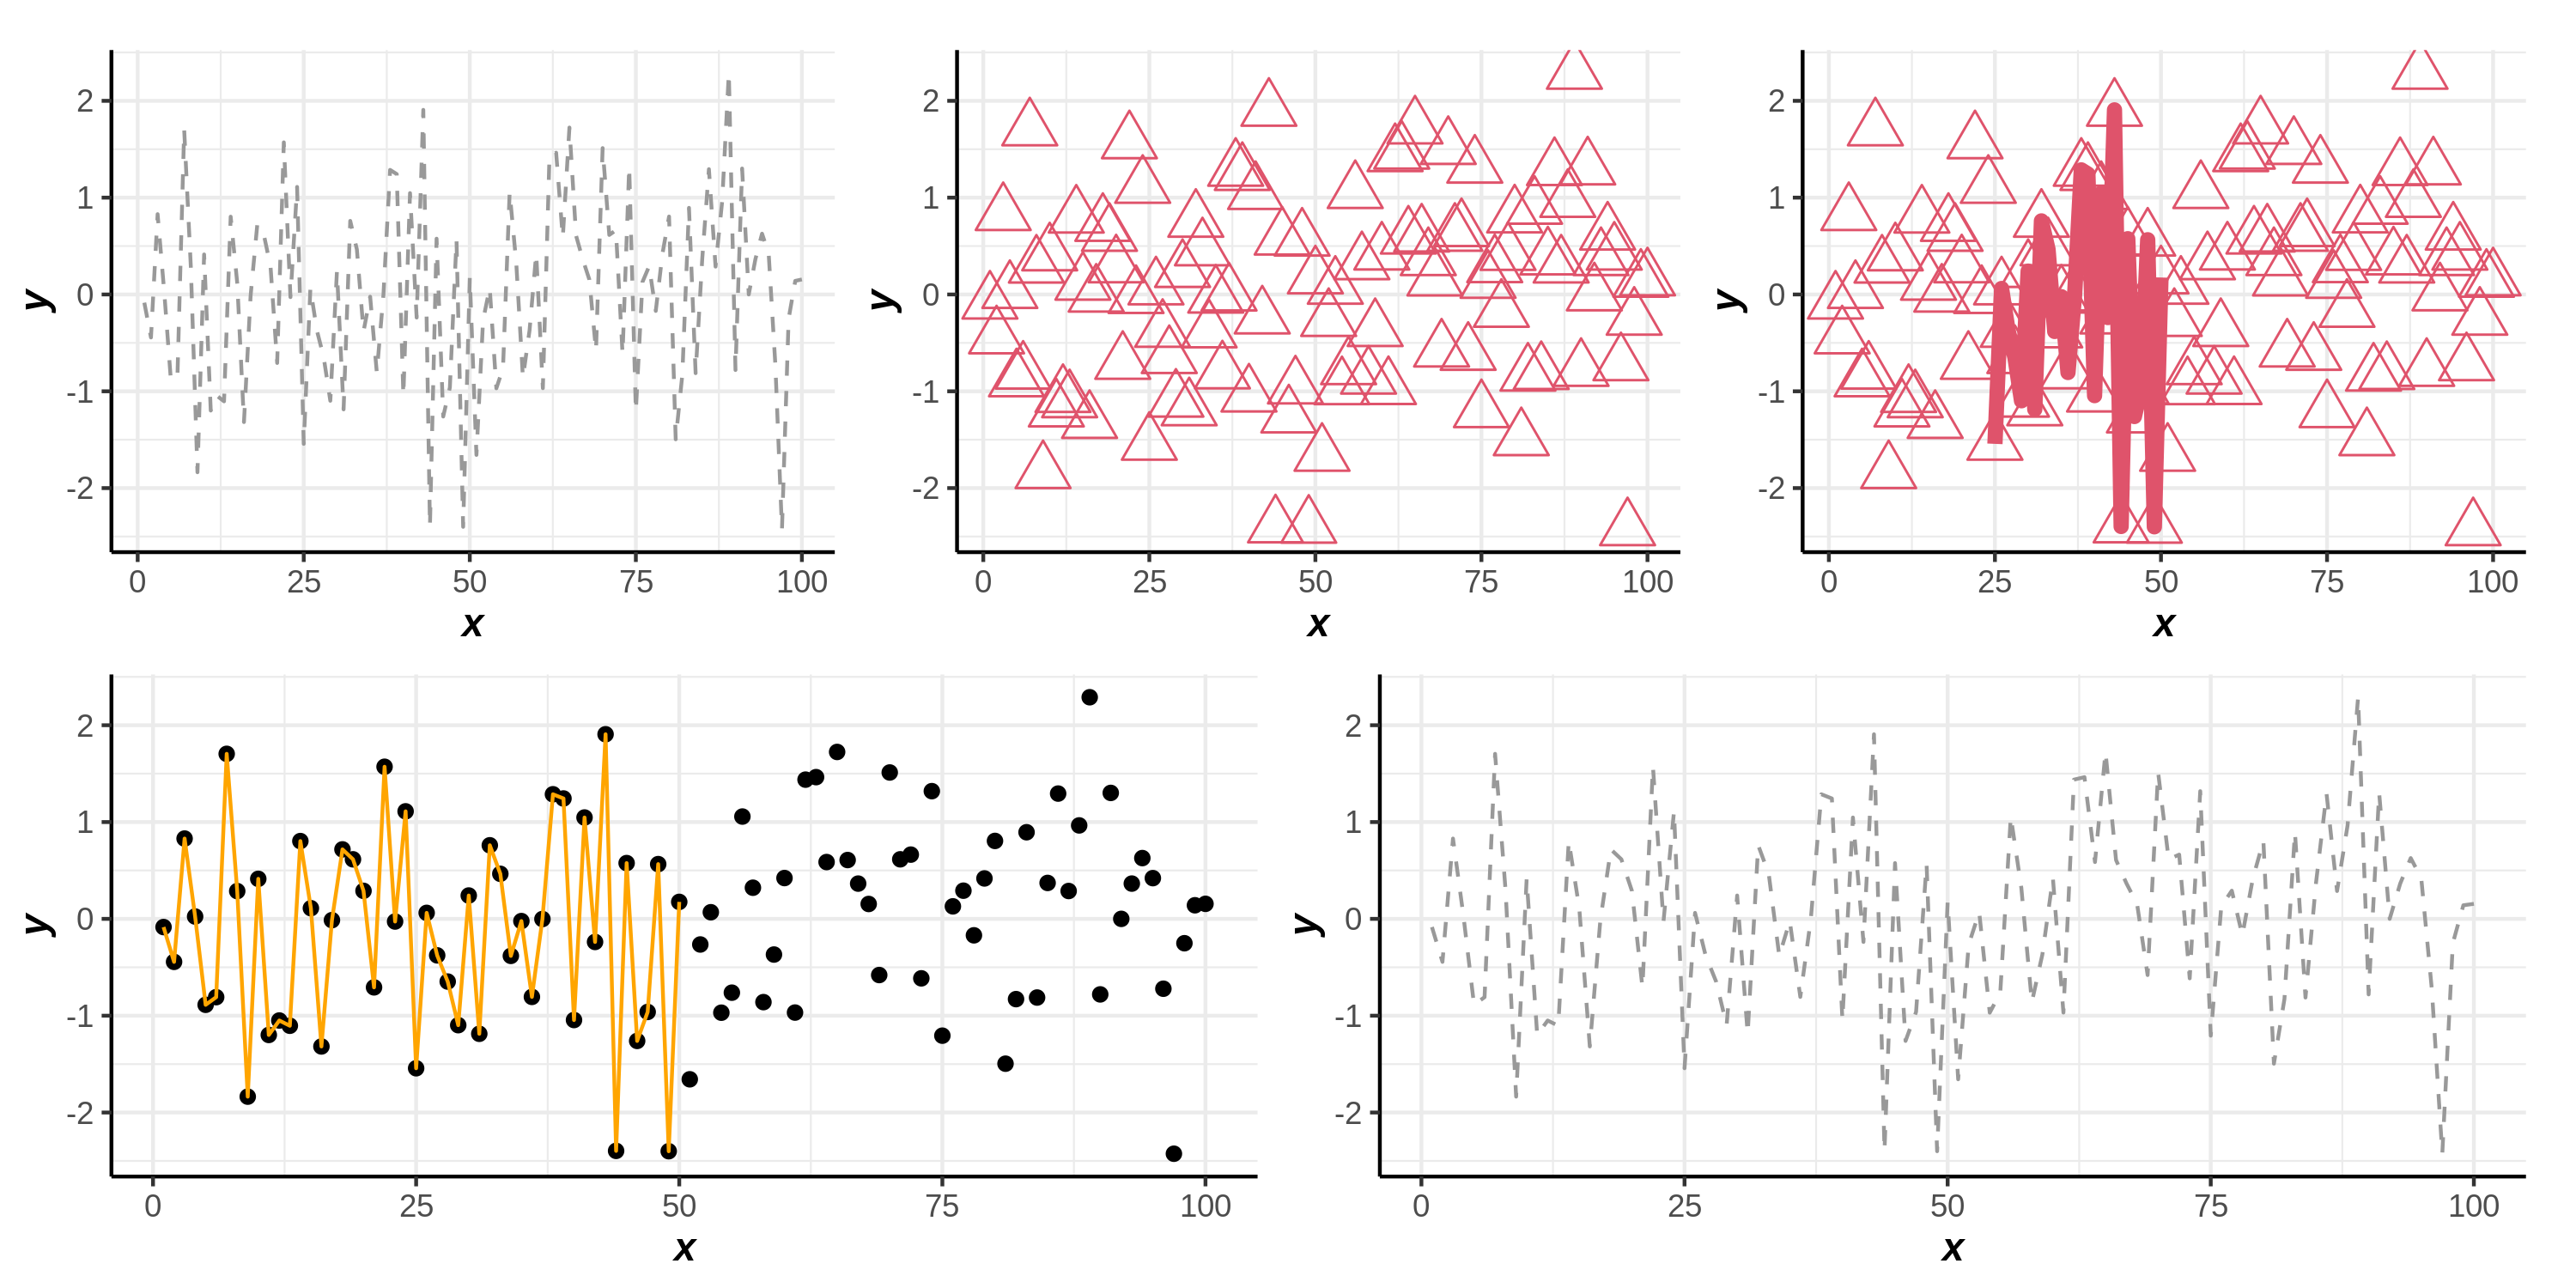
- 예시4: 좀 더 난해한 모양으로 (1)
figsize(10,5)
(p1|p2|p3)/p4
figsize()
- 예시5: 좀 더 난해한 모양으로 (2)
figsize(10,5)
(p1|p2|p3)/(p4|p1)
figsize()
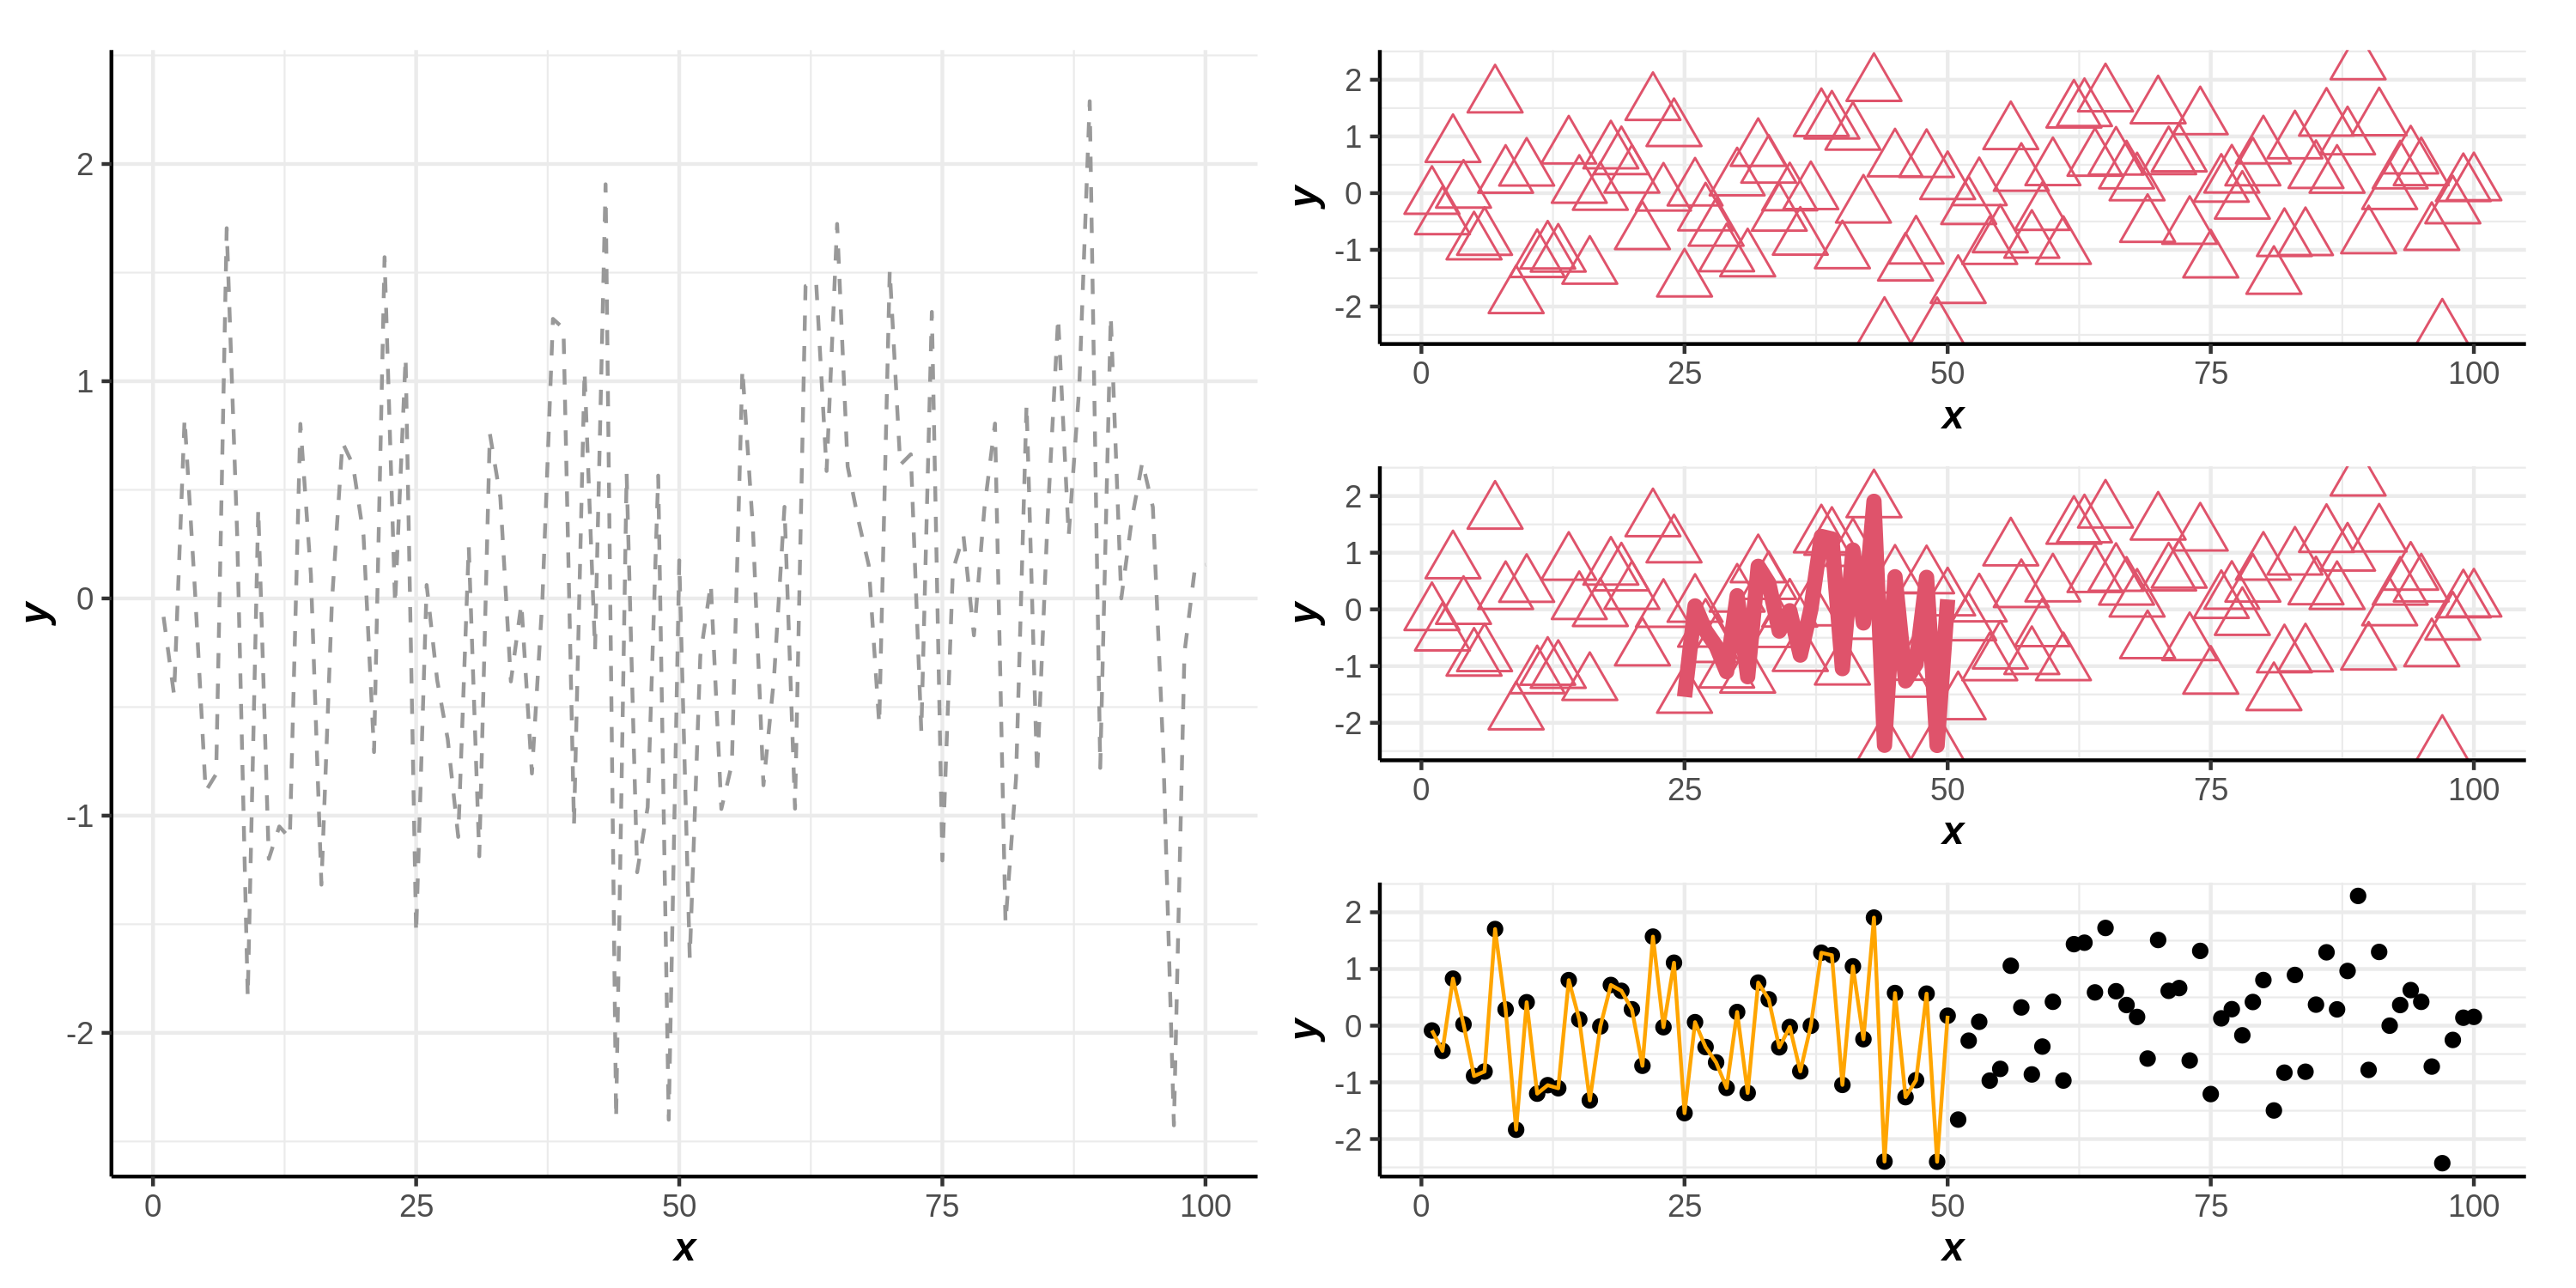
- 예시6: 좀 더 난해한 모양으로 (3)
figsize(10,5)
p1|(p2/p3/p4)
figsize()
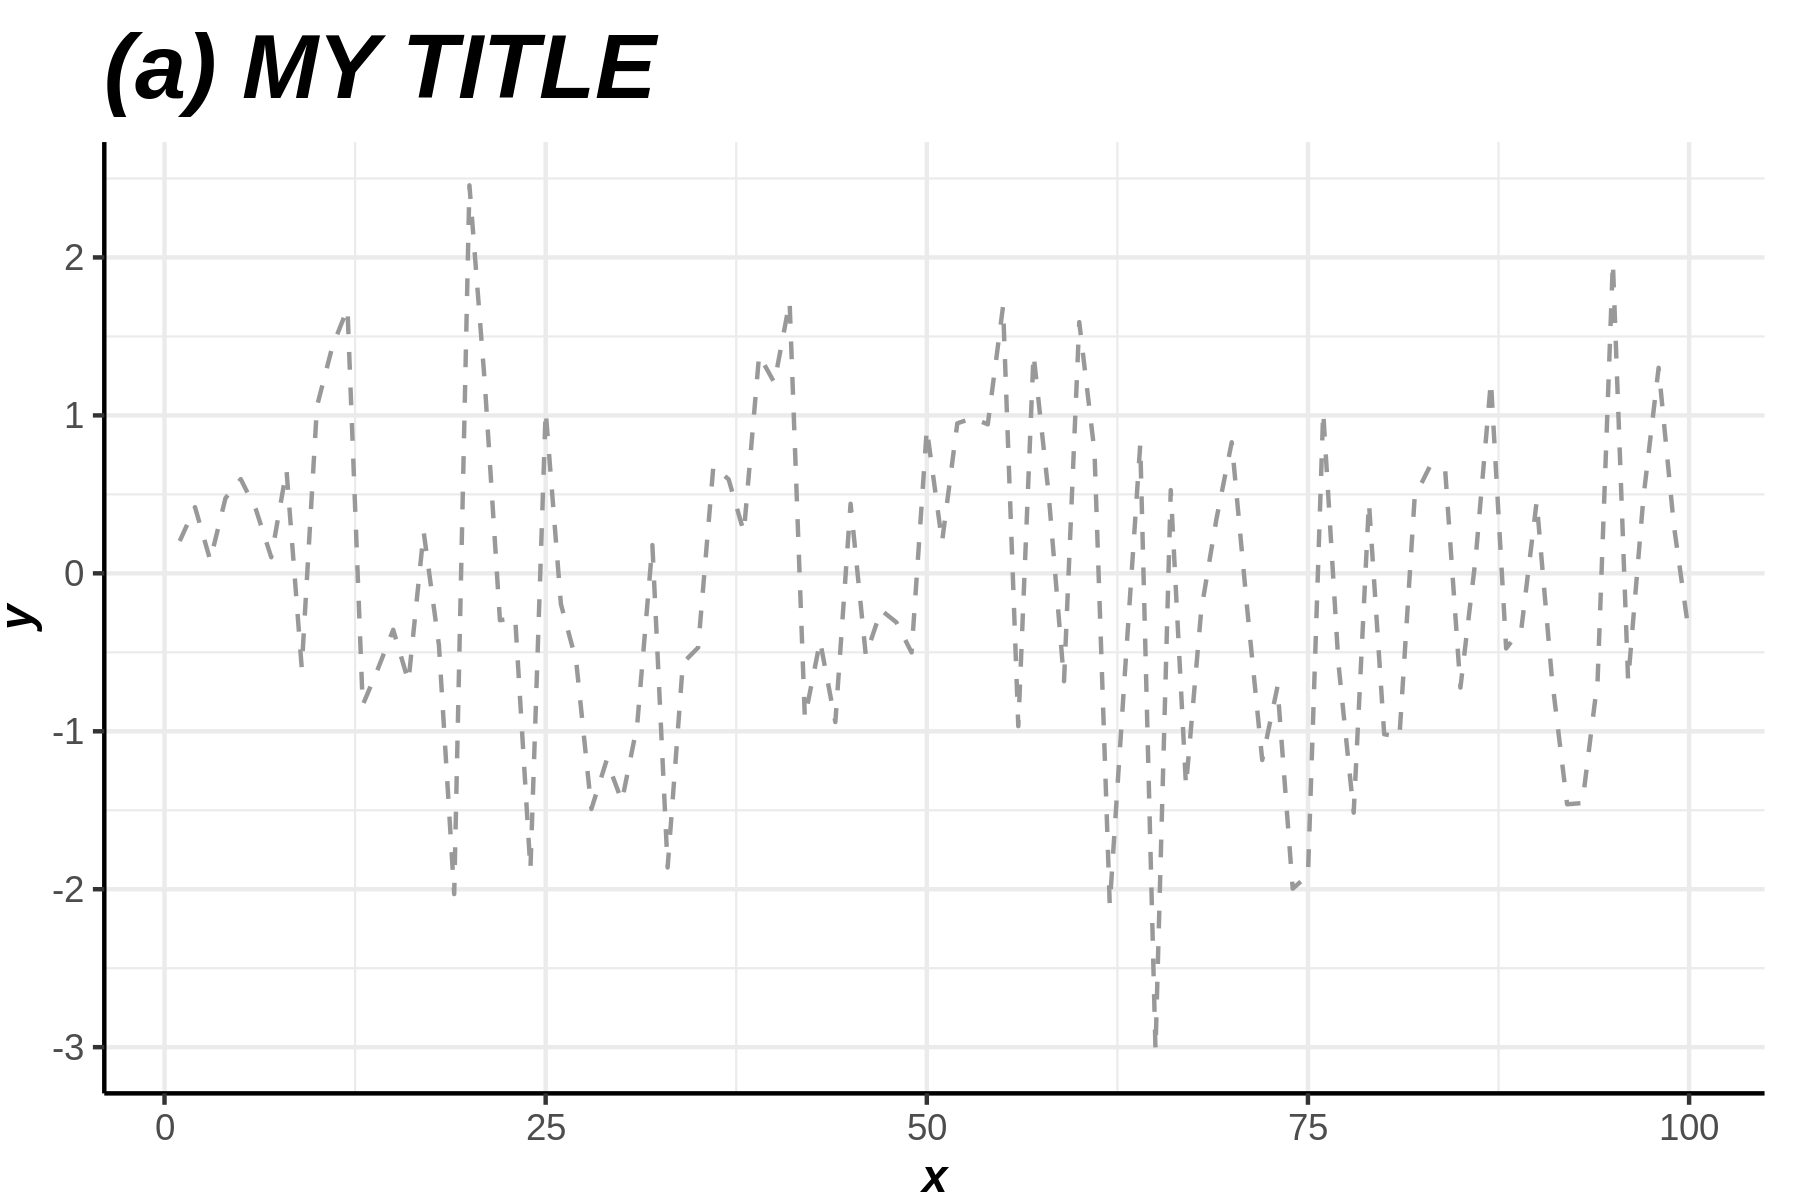
ggtitle
y = rnorm(100)
ggplot() + line(y,lty=2,col='gray60') +
ggtitle("(a) MY TITLE")
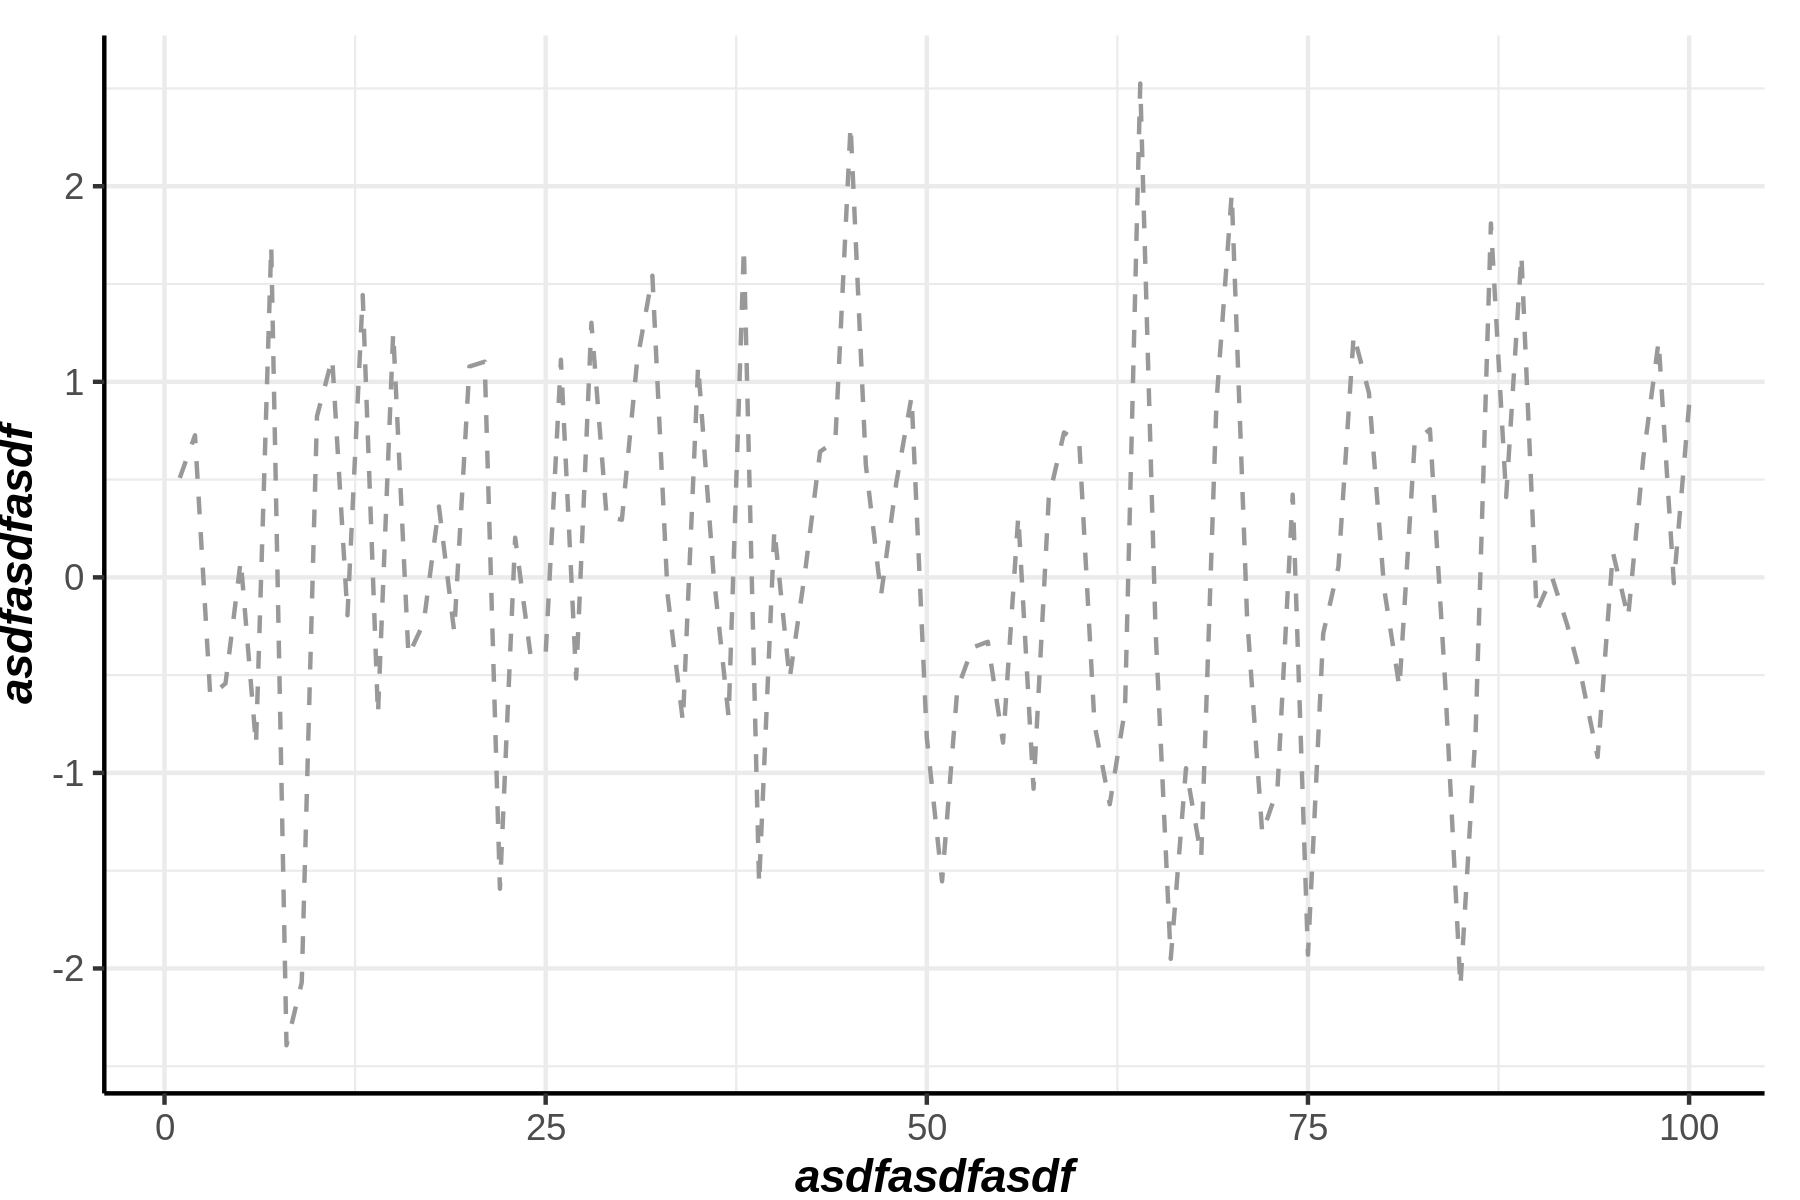
xlab, ylab
y = rnorm(100)
ggplot() + line(y,lty=2,col='gray60') +
xlab("asdfasdfasdf") + ylab("asdfasdfasdf")
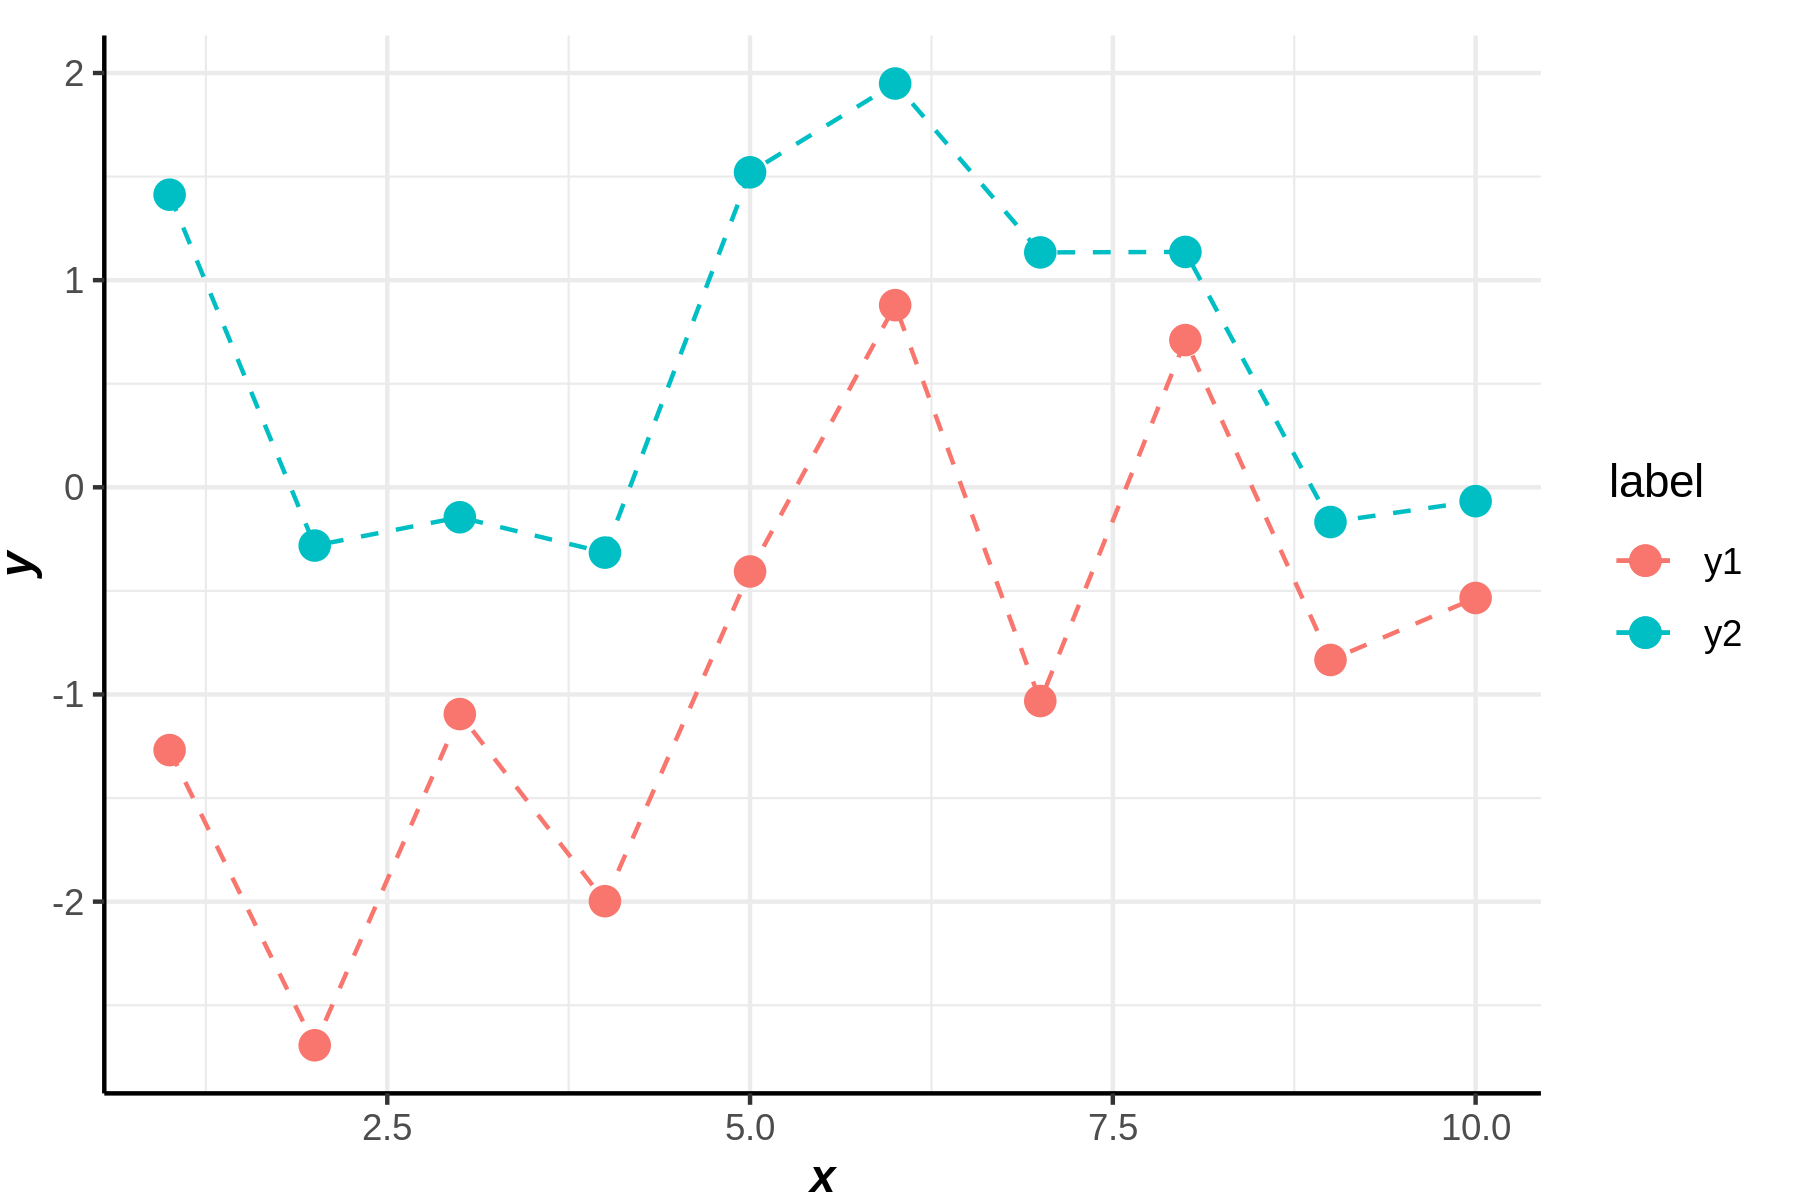
legends
y1 = rnorm(10)
y2 = rnorm(10)
ggplot()+
line(y1,label="y1",lty=2)+point(y1,label="y1",cex=3)+
line(y2,label="y2",lty=2)+point(y2,label="y2",cex=3)
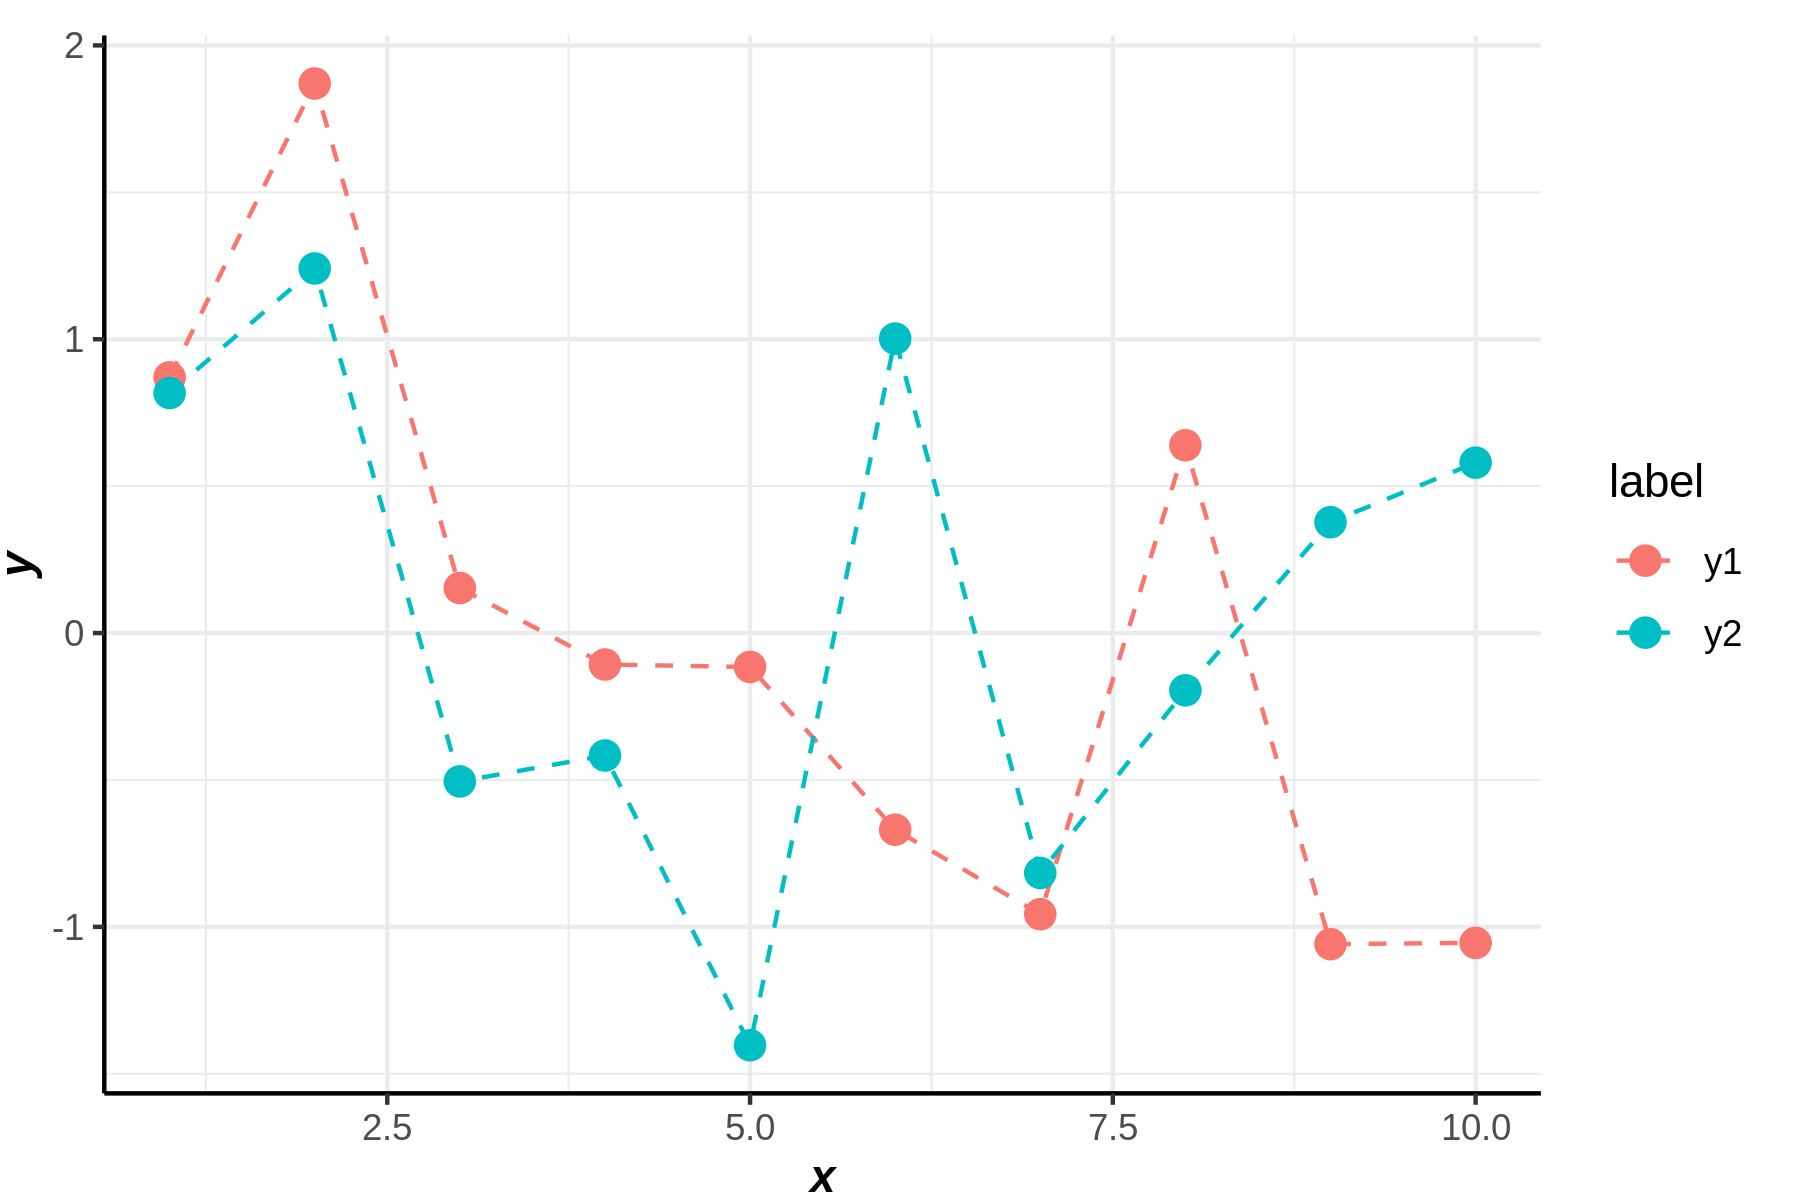
wide_y
- 예시1
y1 = rnorm(10)
y2 = rnorm(10)
figsize(6,4)
ggplot()+line(cbind(y1,y2),lty=2)+point(cbind(y1,y2),cex=3)
figsize()
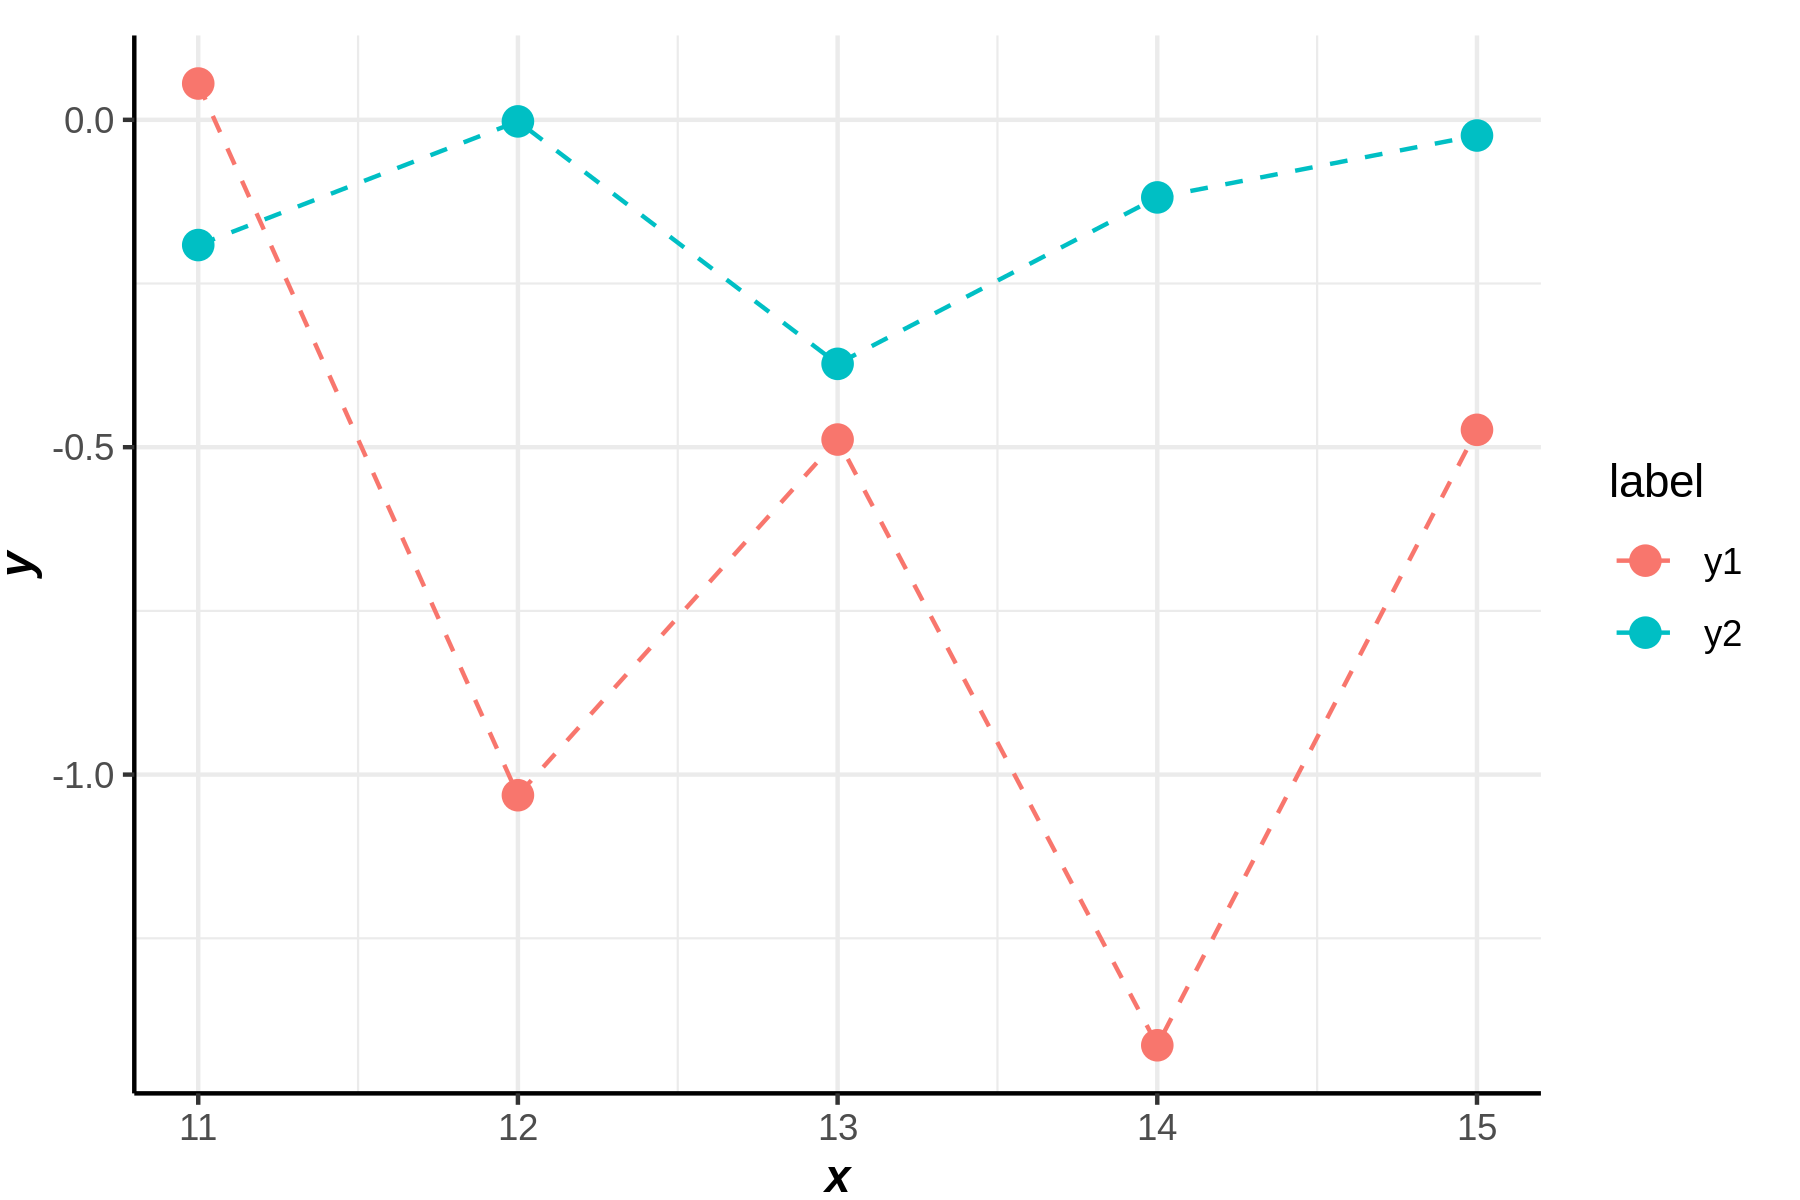
- 예시2
x = 11:15
y1 = rnorm(5)
y2 = rnorm(5)
figsize(6,4)
ggplot()+line(x,cbind(y1,y2),lty=2)+point(x,cbind(y1,y2),cex=3)
figsize()
2D geoms
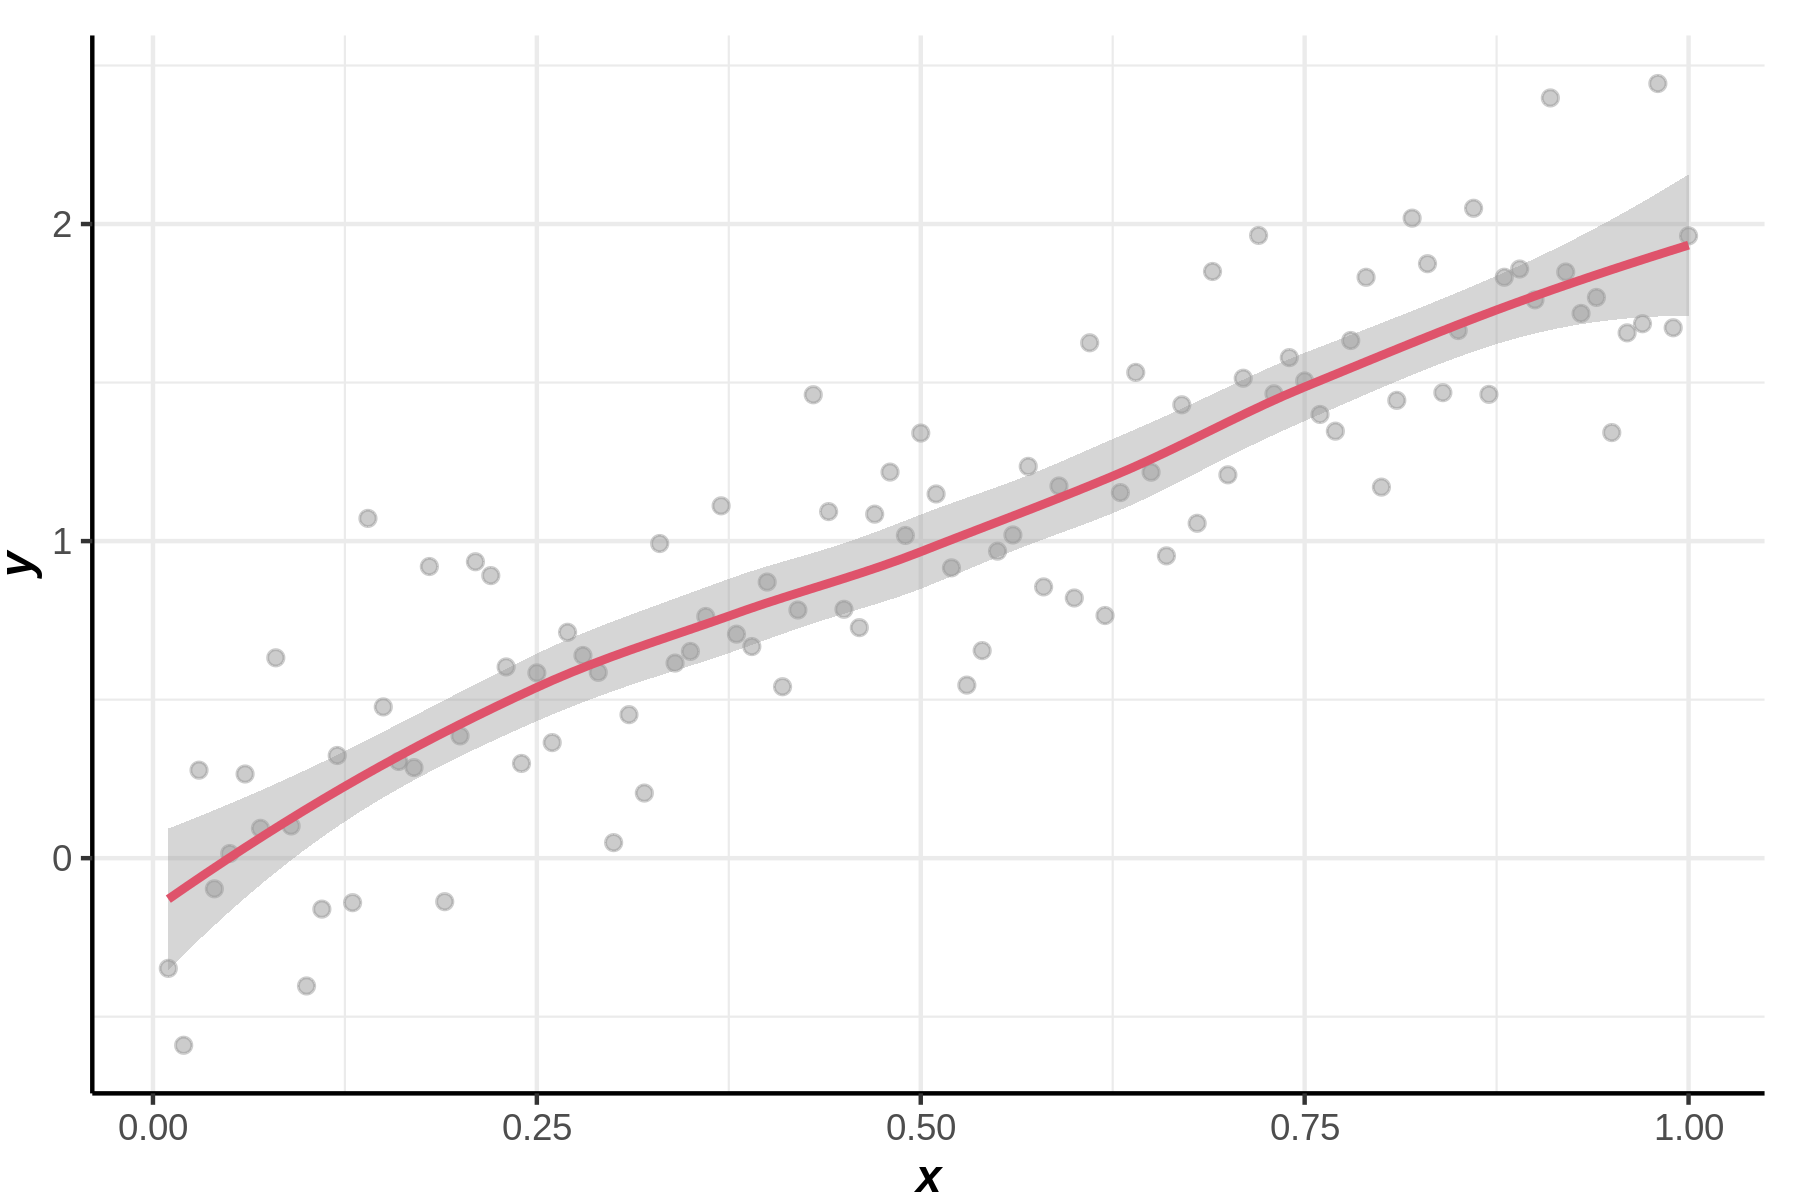
smooth
x = 1:100/100
y1 = 2*x + rnorm(100)*0.3
y2 = -3*x + rnorm(100)*0.3 +3
- 예시1
ggplot()+point(x,y1,alpha=0.5,col="gray60") + smooth(x,y1,col=2)
`geom_smooth()` using method = 'loess' and formula = 'y ~ x'
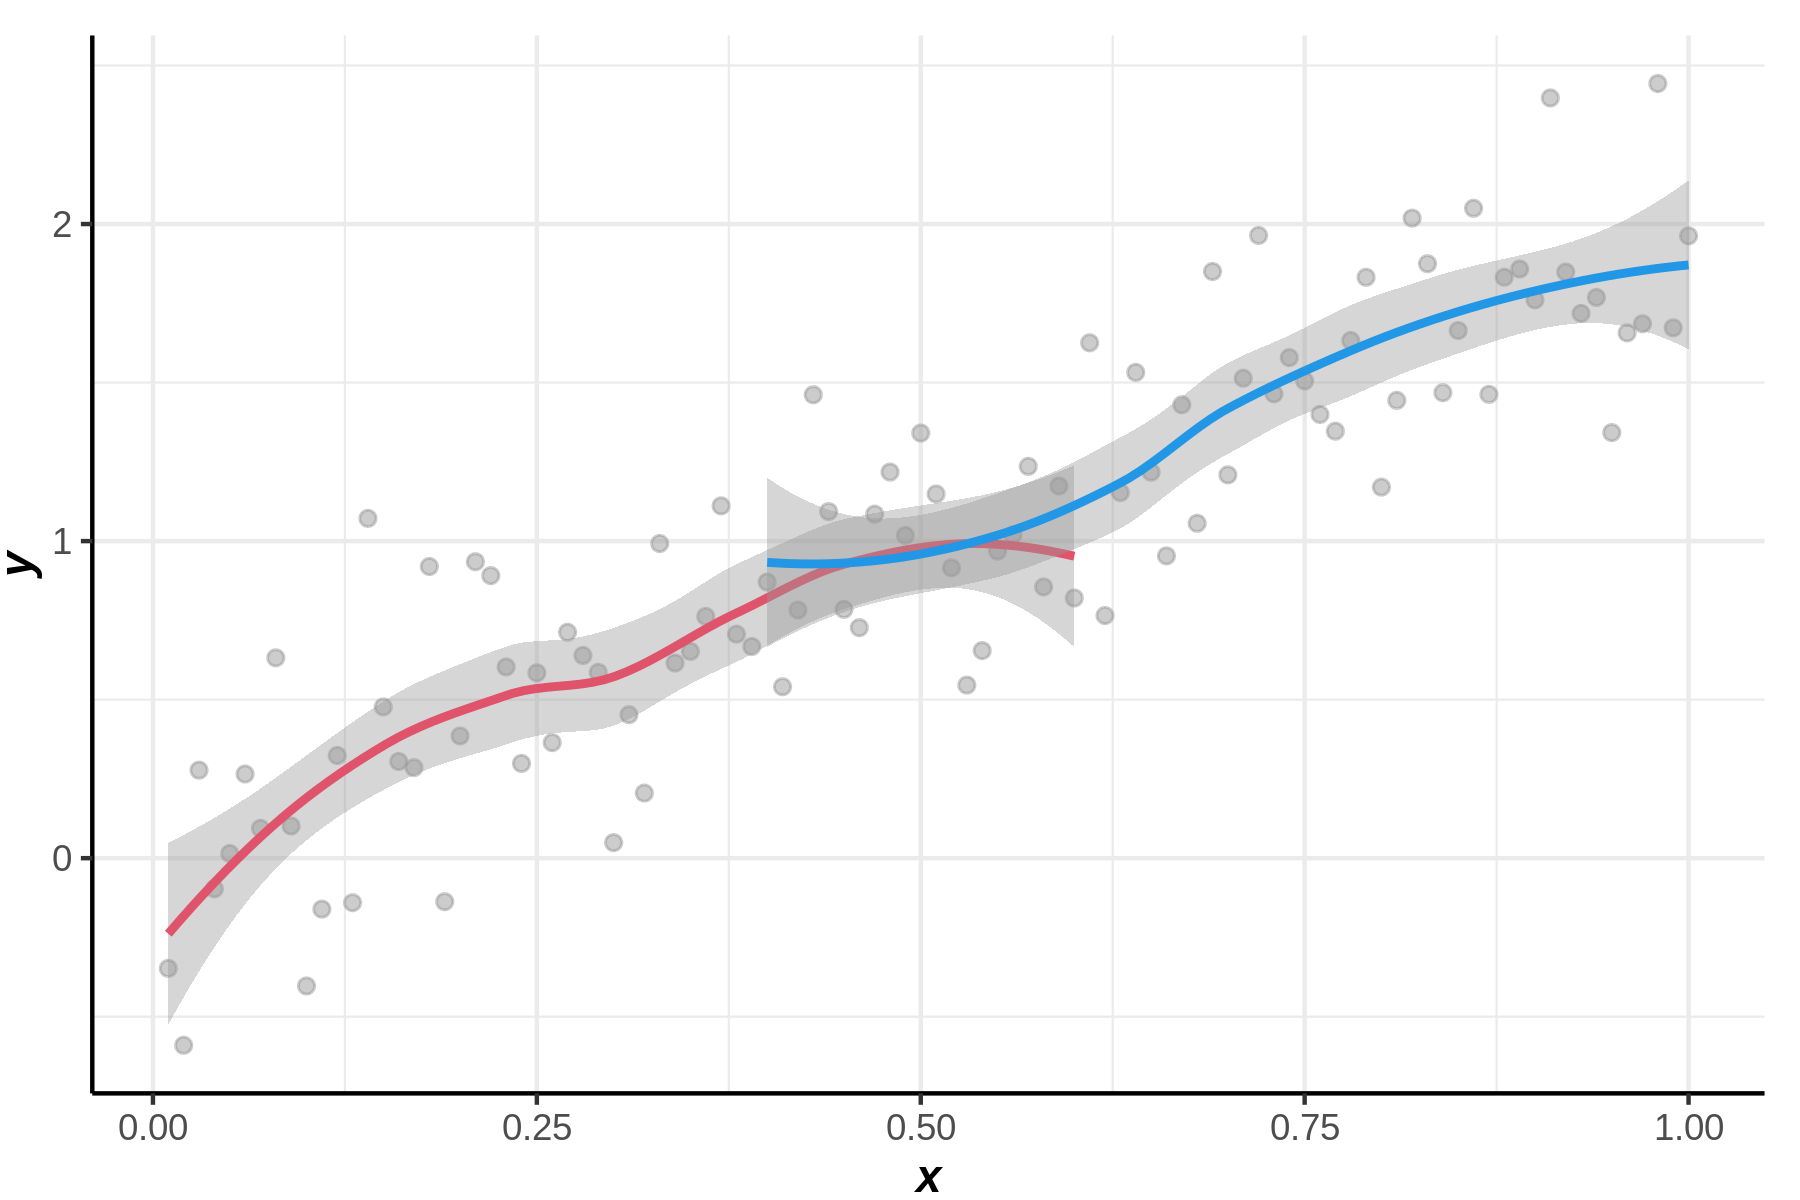
- 예시2
ggplot()+point(x,y1,alpha=0.5,col="gray60") +
smooth(x[1:60],y1[1:60],col=2) +
smooth(x[40:100],y1[40:100],col=4)
`geom_smooth()` using method = 'loess' and formula = 'y ~ x'
`geom_smooth()` using method = 'loess' and formula = 'y ~ x'
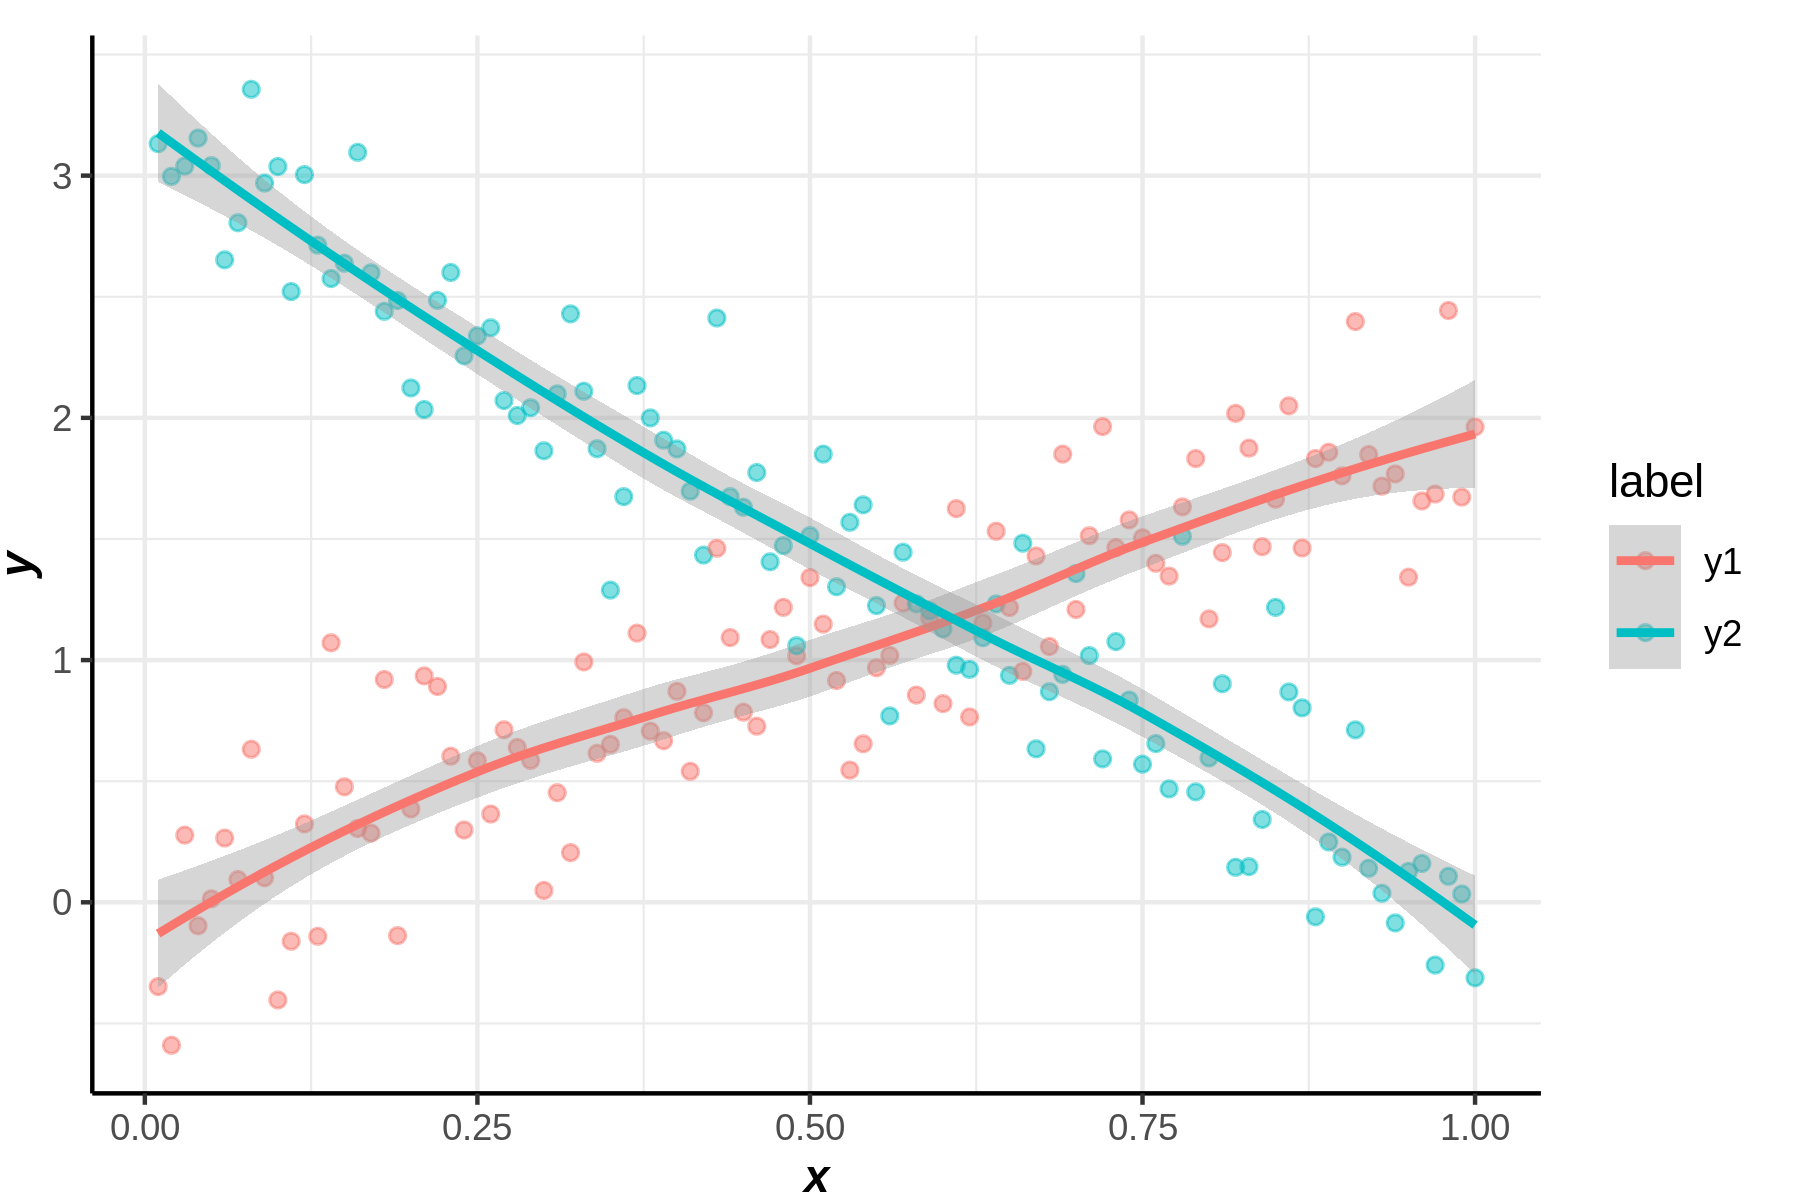
- 예시3
ggplot()+point(x,cbind(y1,y2),alpha=0.5) +
smooth(x,cbind(y1,y2))
`geom_smooth()` using method = 'loess' and formula = 'y ~ x'
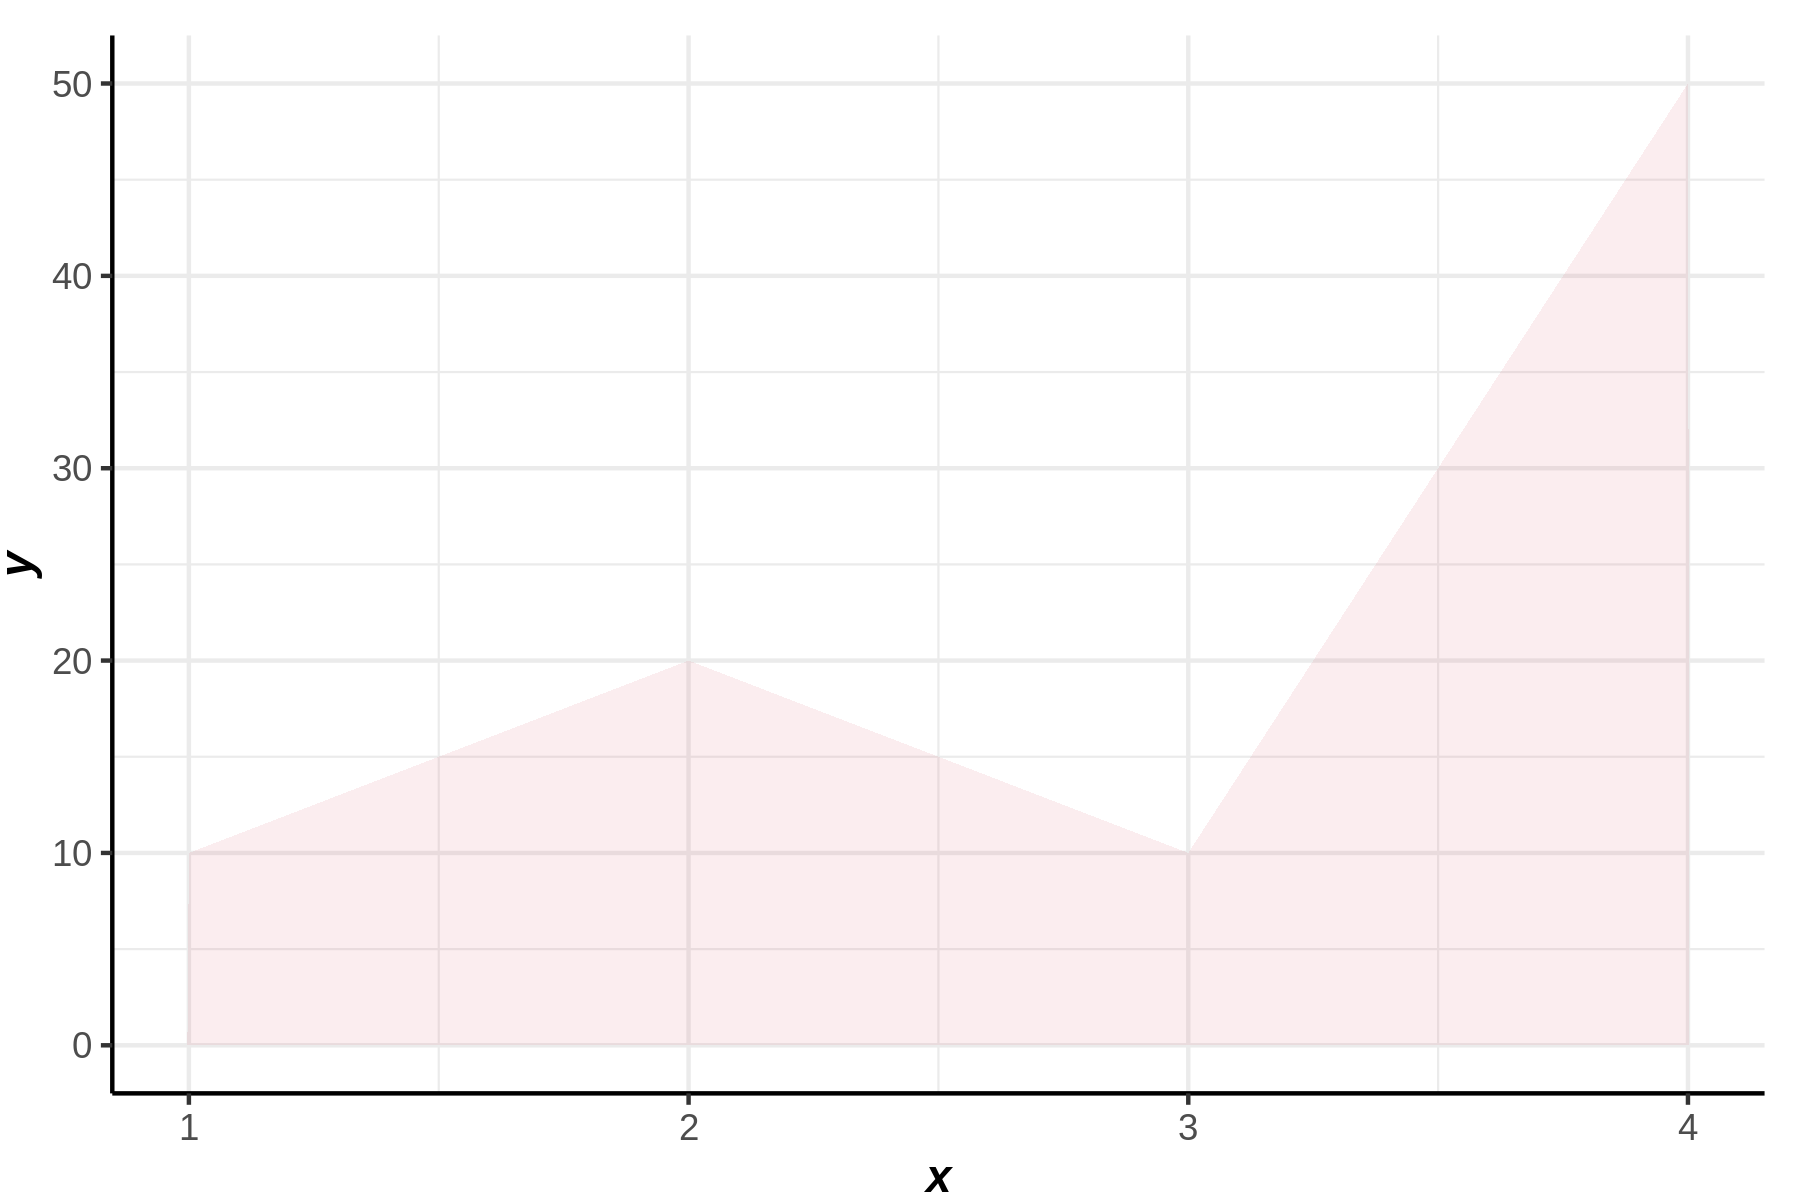
area
y1 = c(10,20,10,50)
y2 = c(15,20,5,30)
- 예시1
ggplot() + area(y1,fill=2)
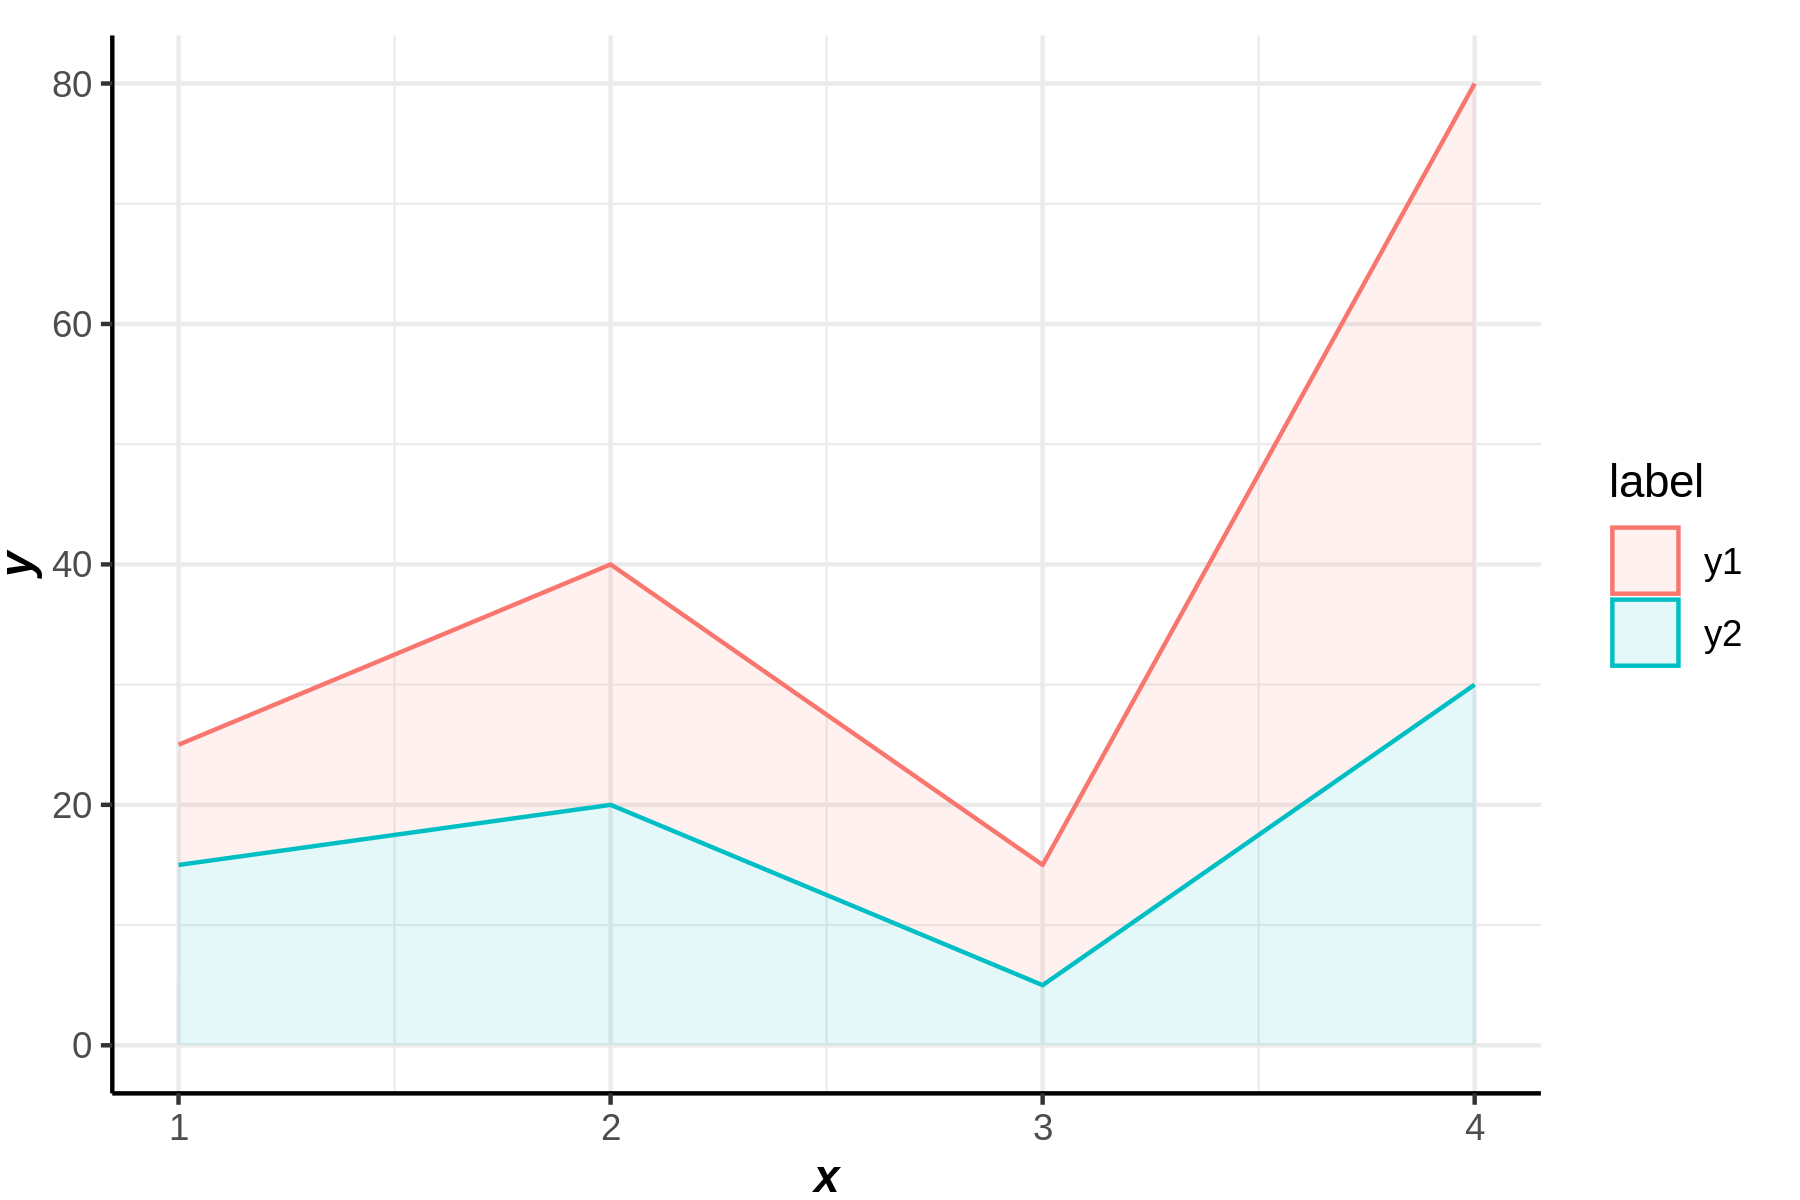
- 예시2
ggplot() + area(cbind(y1,y2))
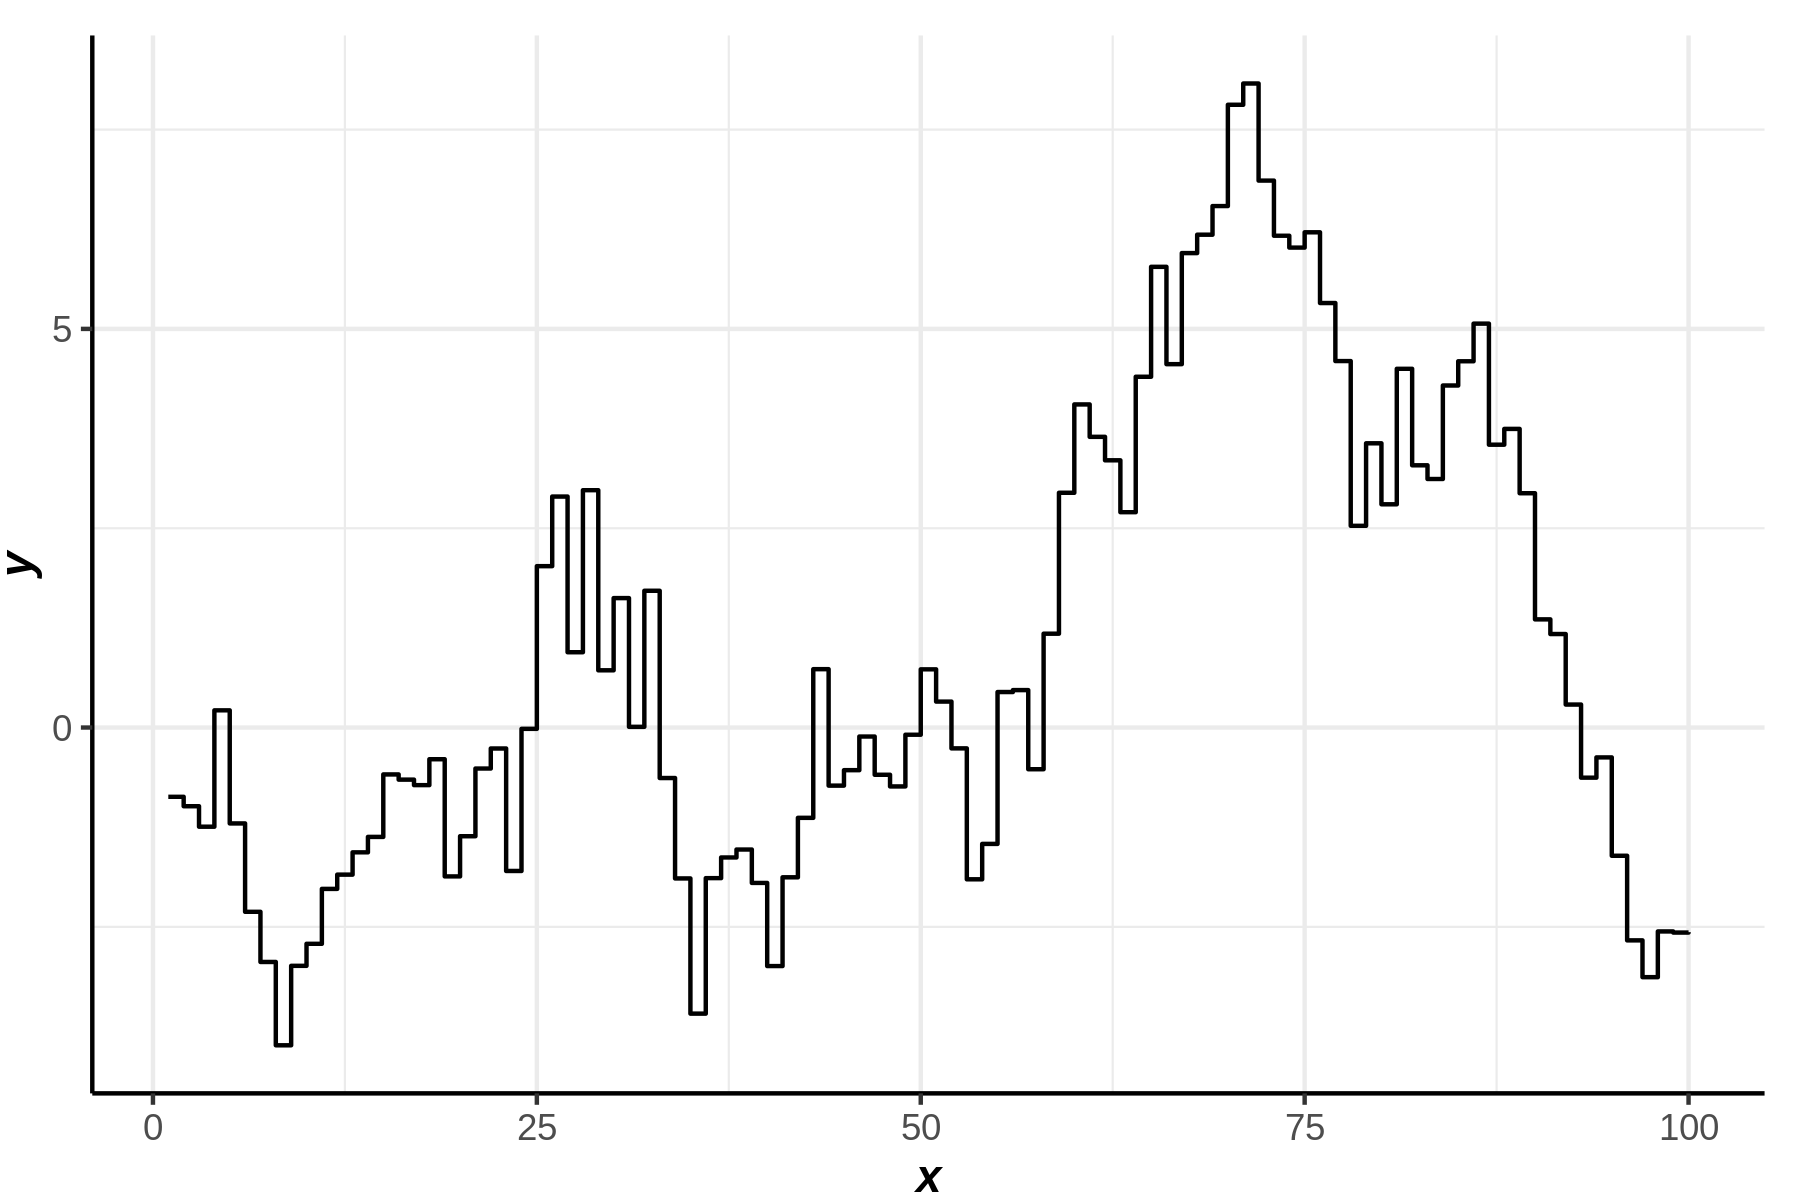
step
y1 = cumsum(rnorm(100))
y2 = cumsum(rnorm(100))
- 예시1
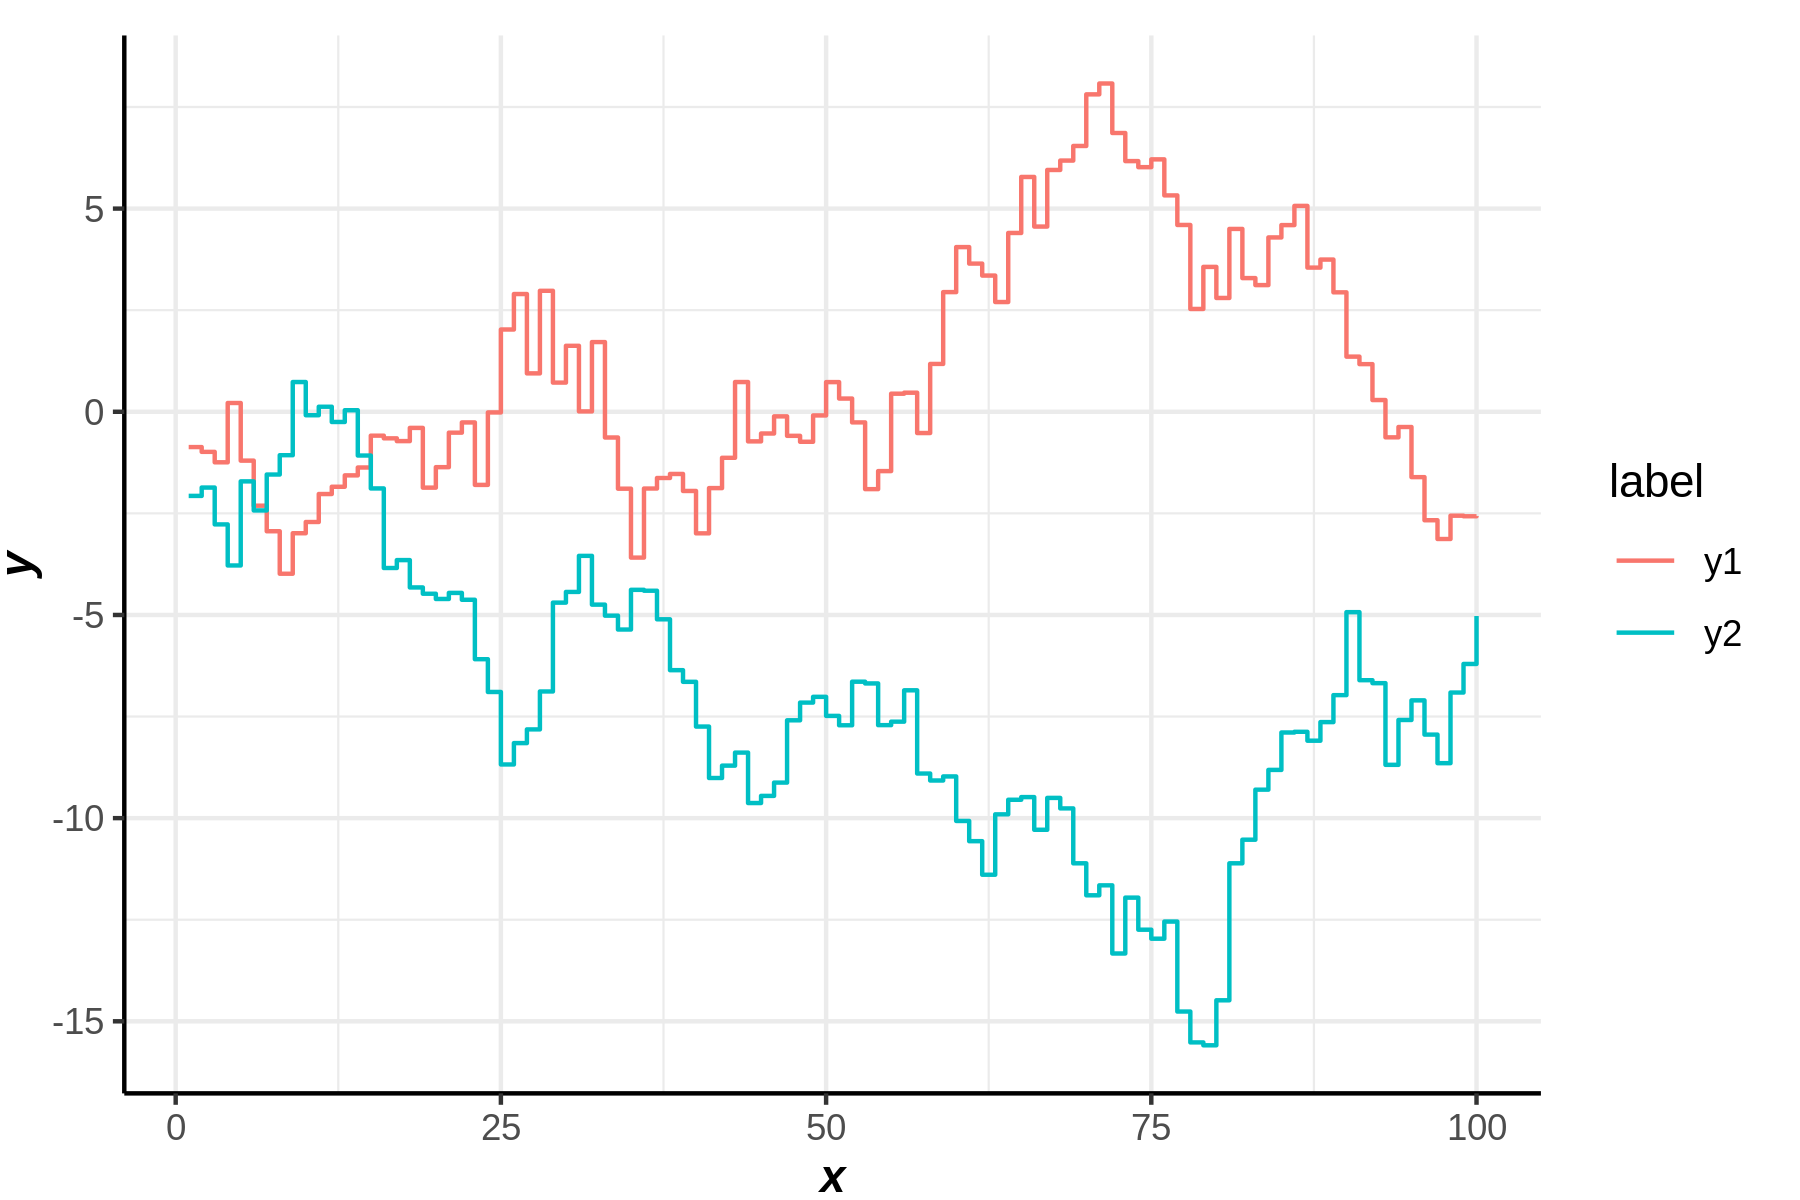
- 예시2
ggplot() + step(cbind(y1,y2))
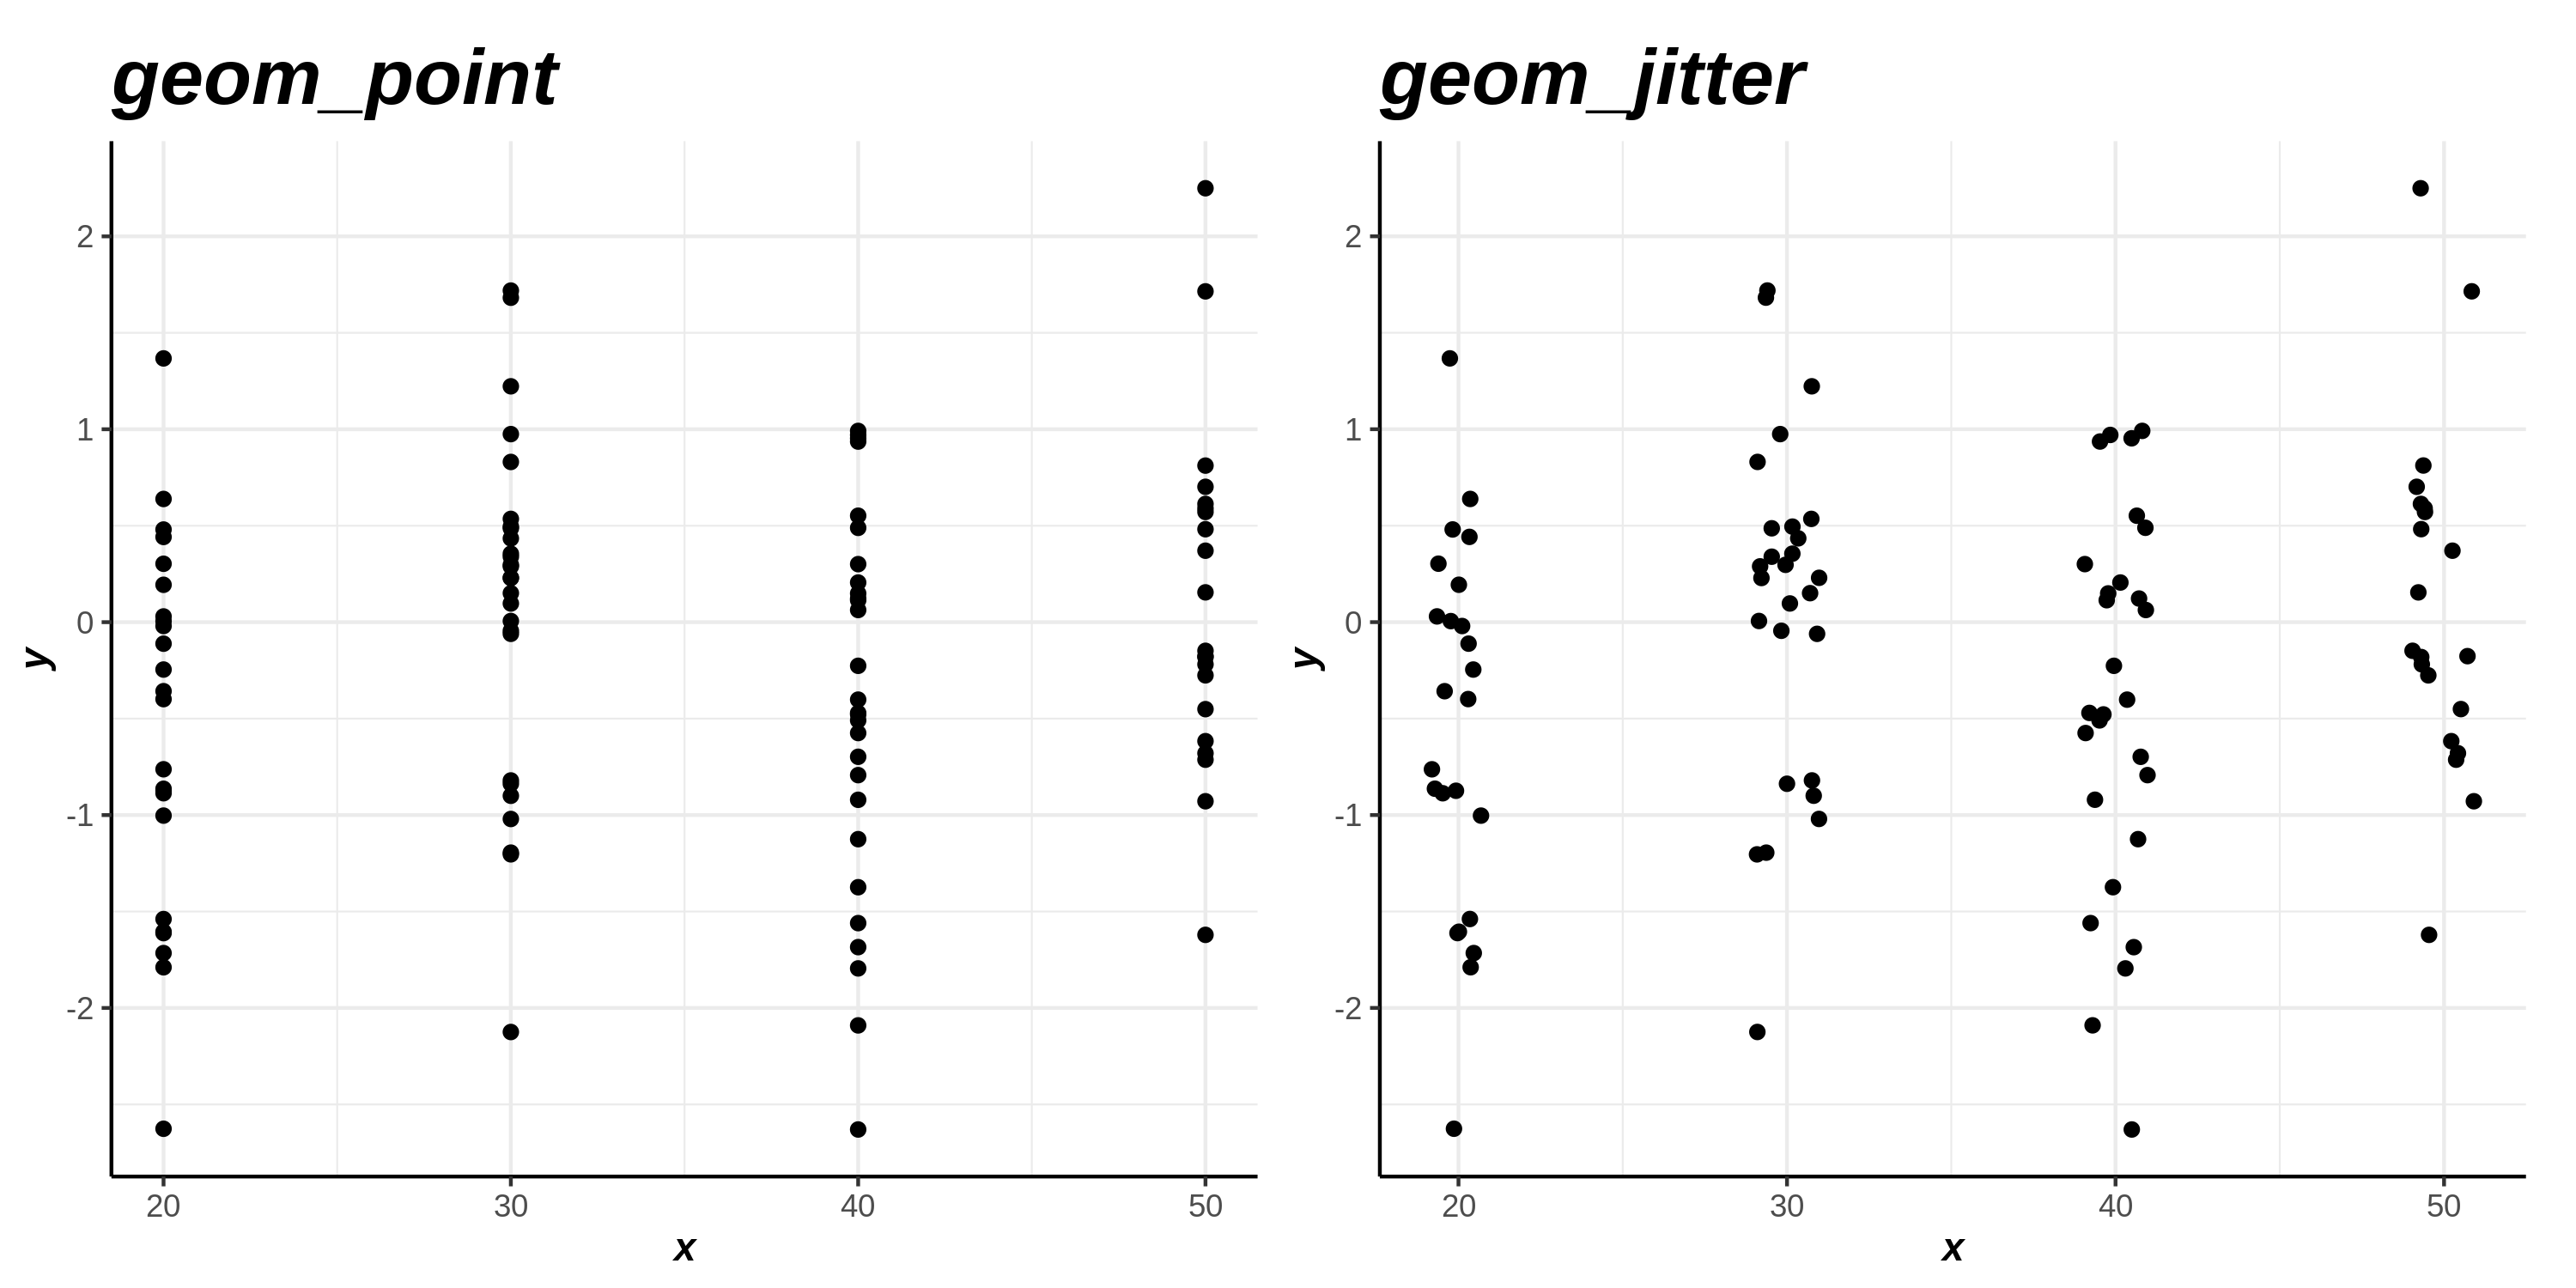
jitter
x = sample(c(20,30,40,50),size=100,replace = TRUE)
y = rnorm(100)
p1 = ggplot()+point(x,y)+ggtitle("geom_point")
p2 = ggplot()+jitter(x,y,width = 1) + ggtitle("geom_jitter")
figsize(10,5)
p1|p2
figsize()
1D geoms
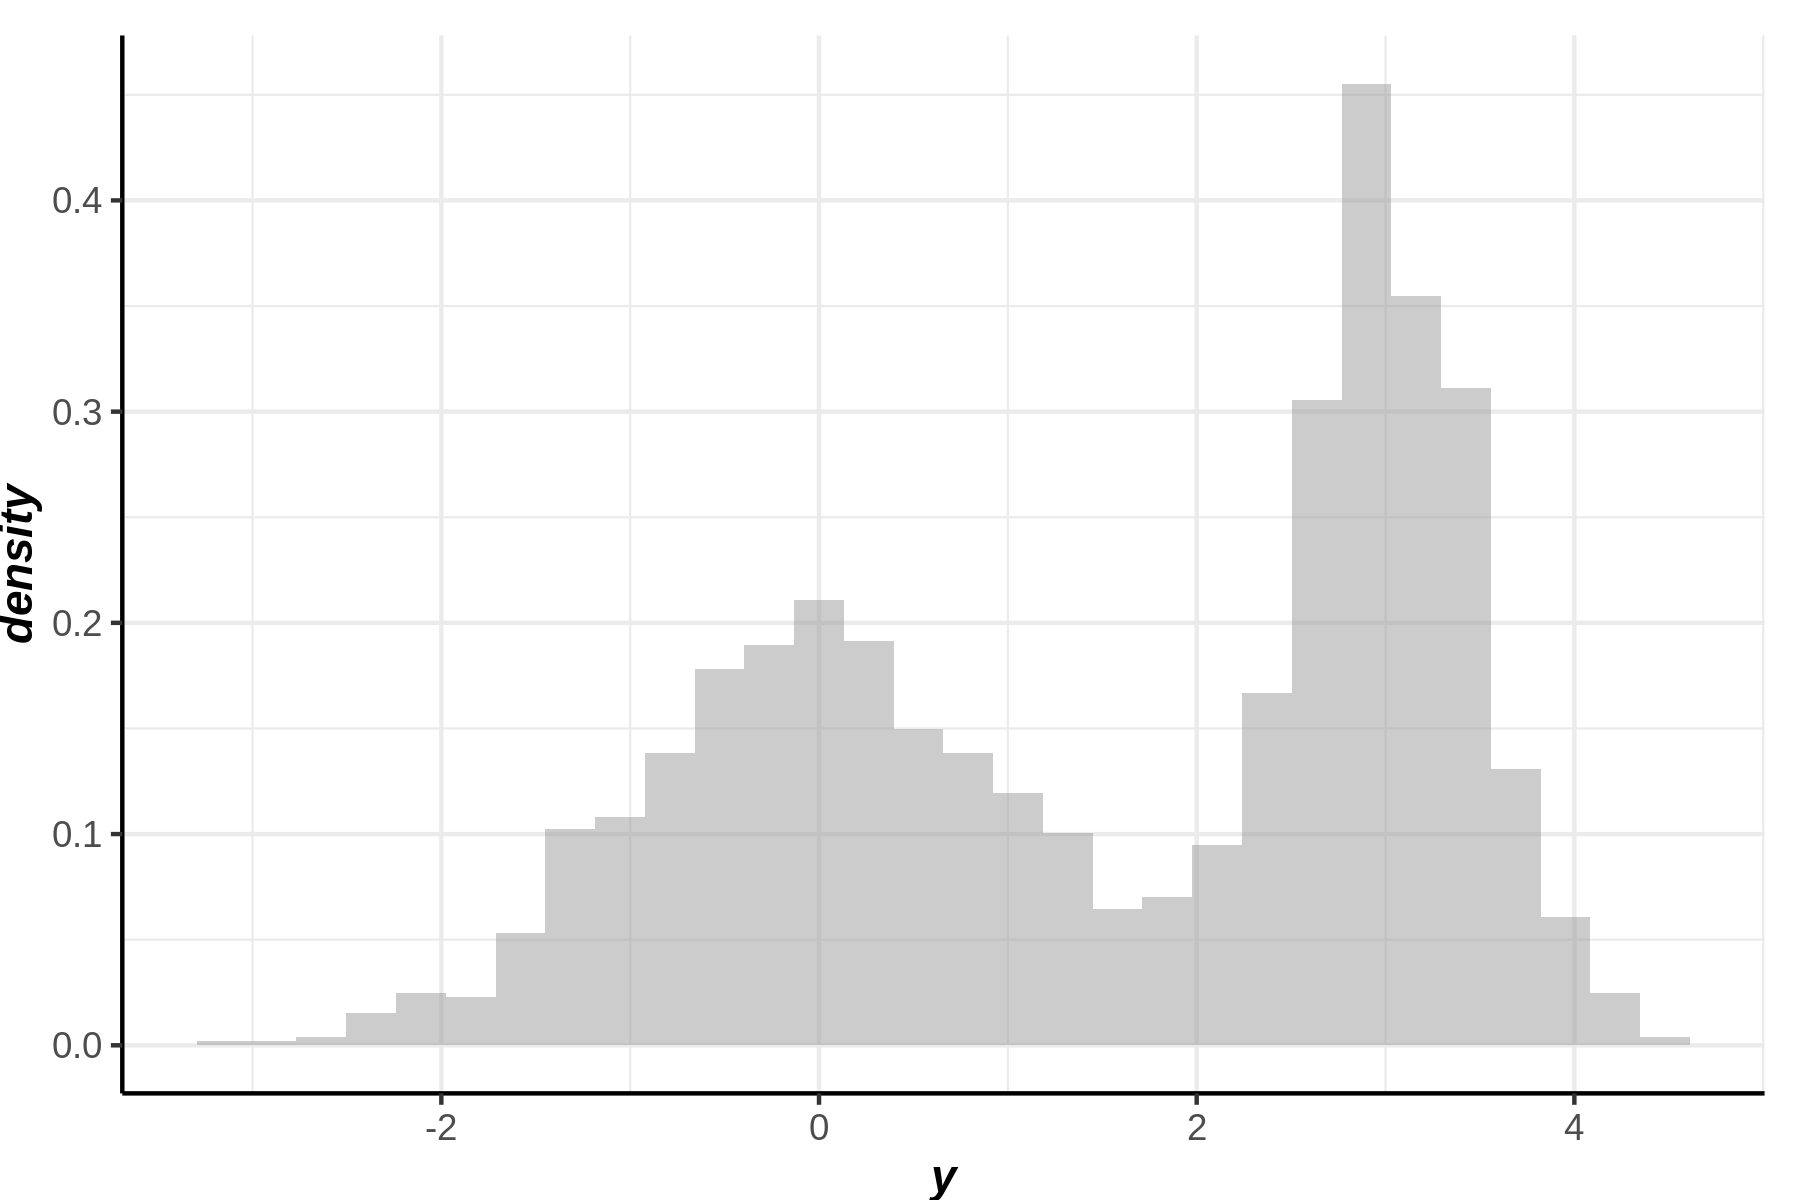
histogram
y1 = rnorm(1000)
y2 = rnorm(1000)*0.5 + 3
- 예시1
ggplot()+histogram(c(y1,y2),fill="gray60")
Warning message:
“`stat(density)` was deprecated in ggplot2 3.4.0.
ℹ Please use `after_stat(density)` instead.”
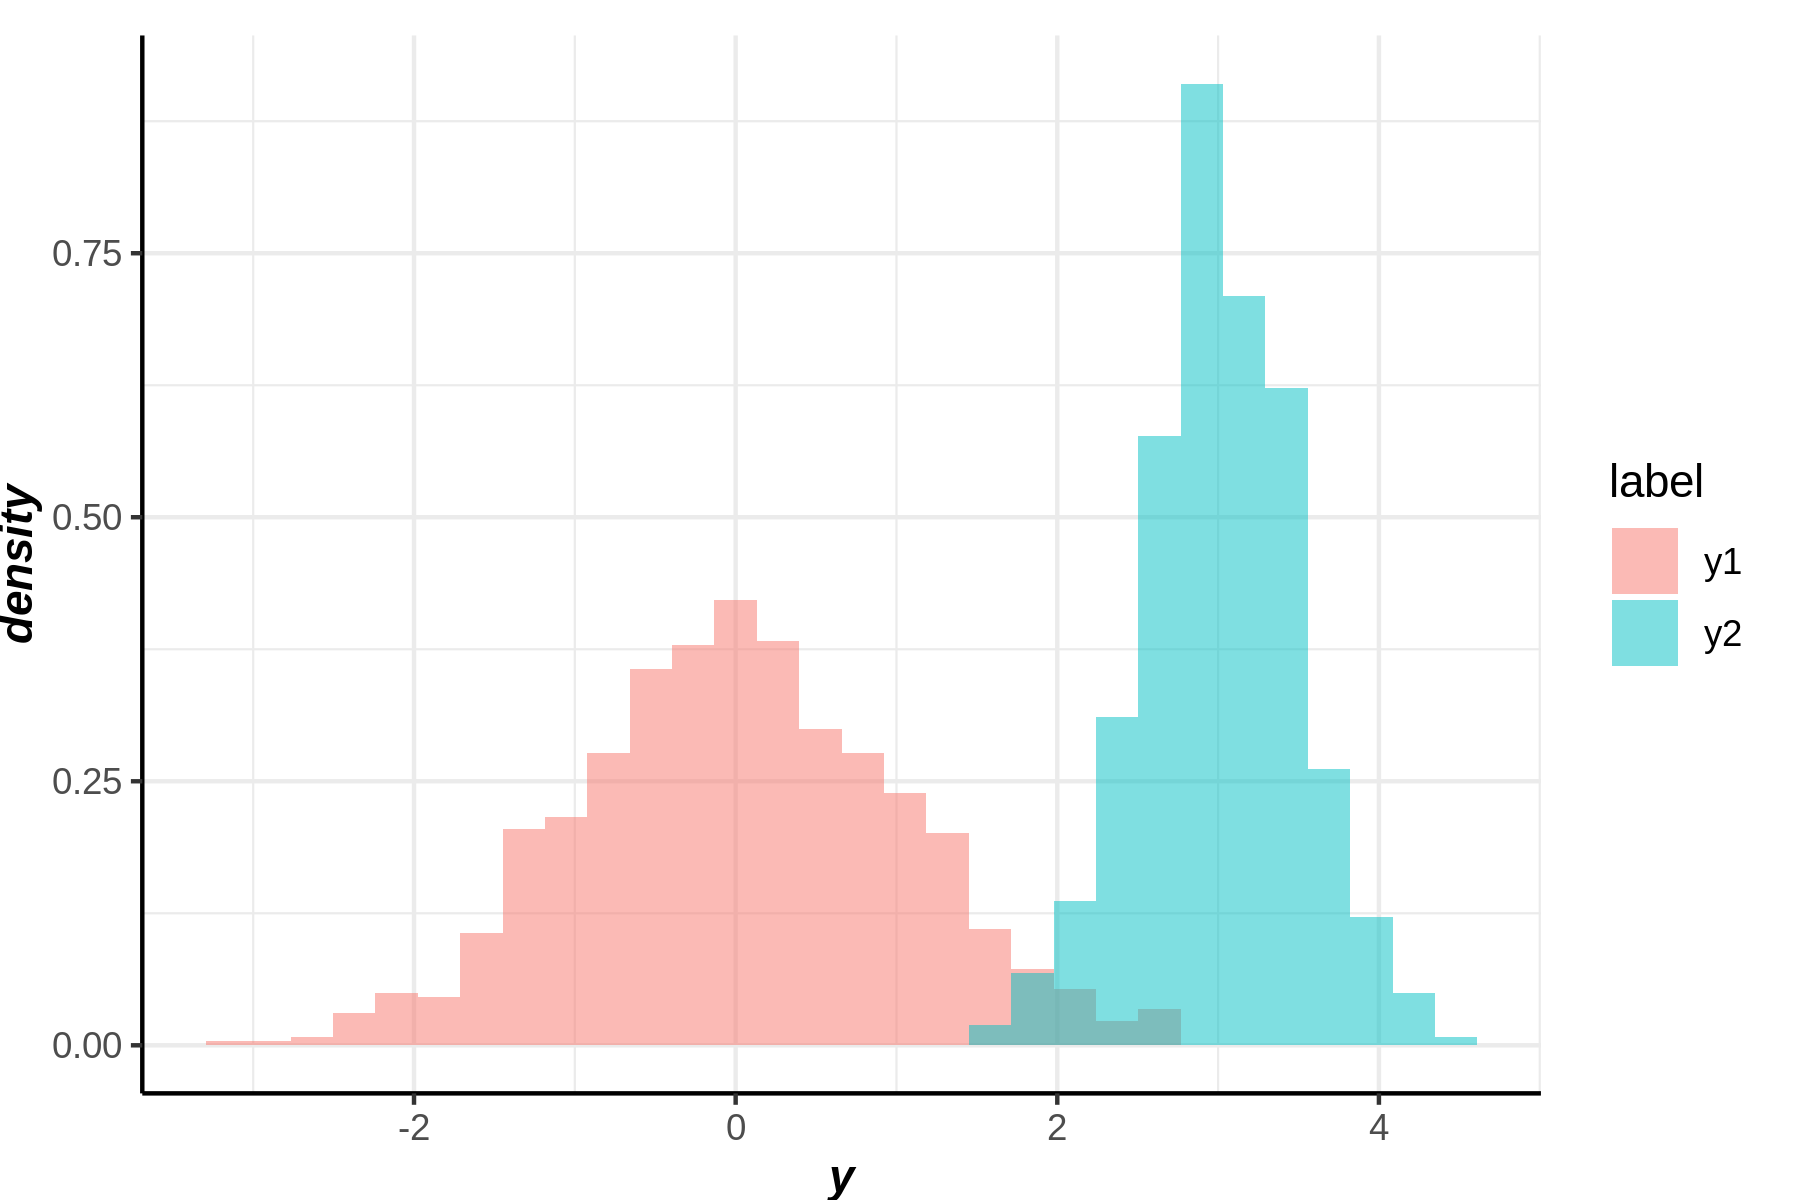
- 예시2
ggplot()+histogram(y1,label="A")+histogram(y2,label="B")
- 예시3
ggplot()+histogram(cbind(y1,y2))
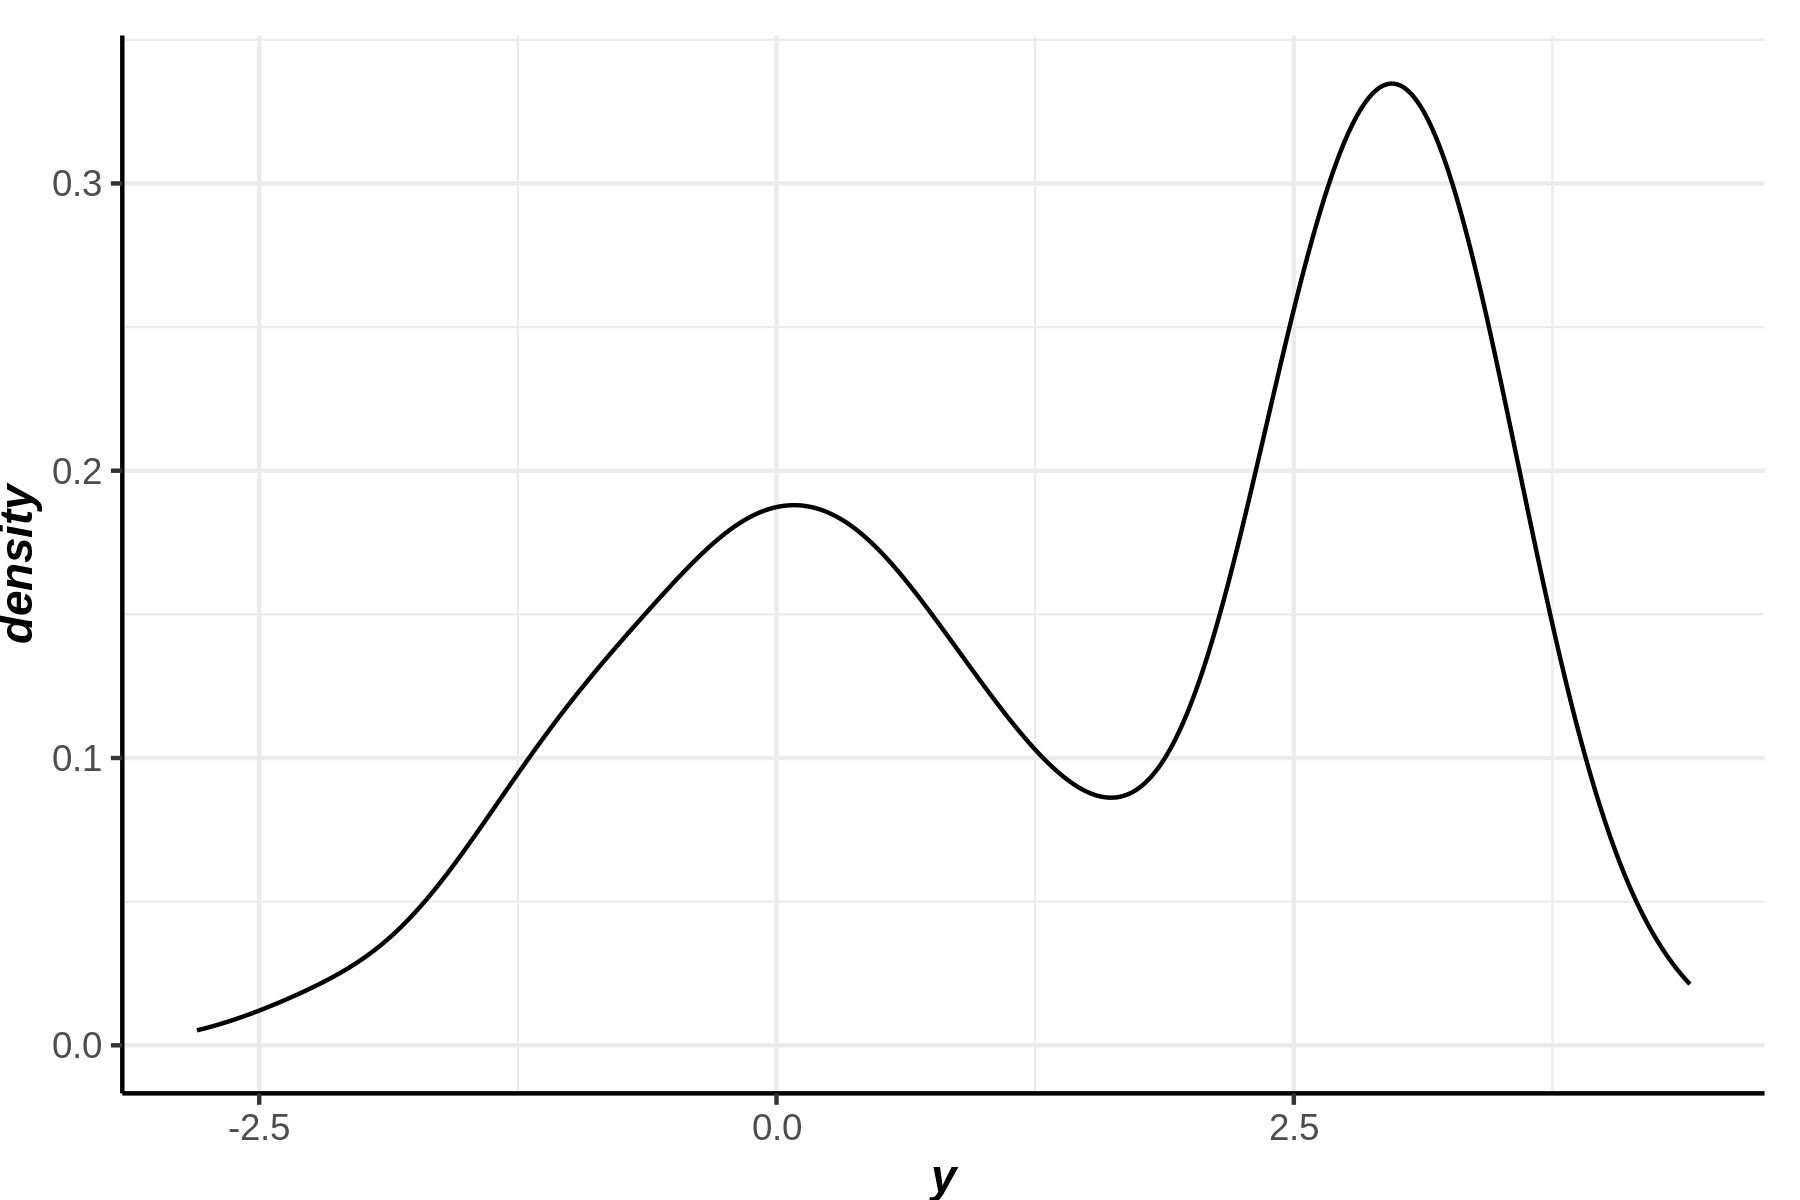
density
y1 = rnorm(1000)
y2 = rnorm(1000)*0.5 + 3
- 예시1
ggplot()+density(c(y1,y2))
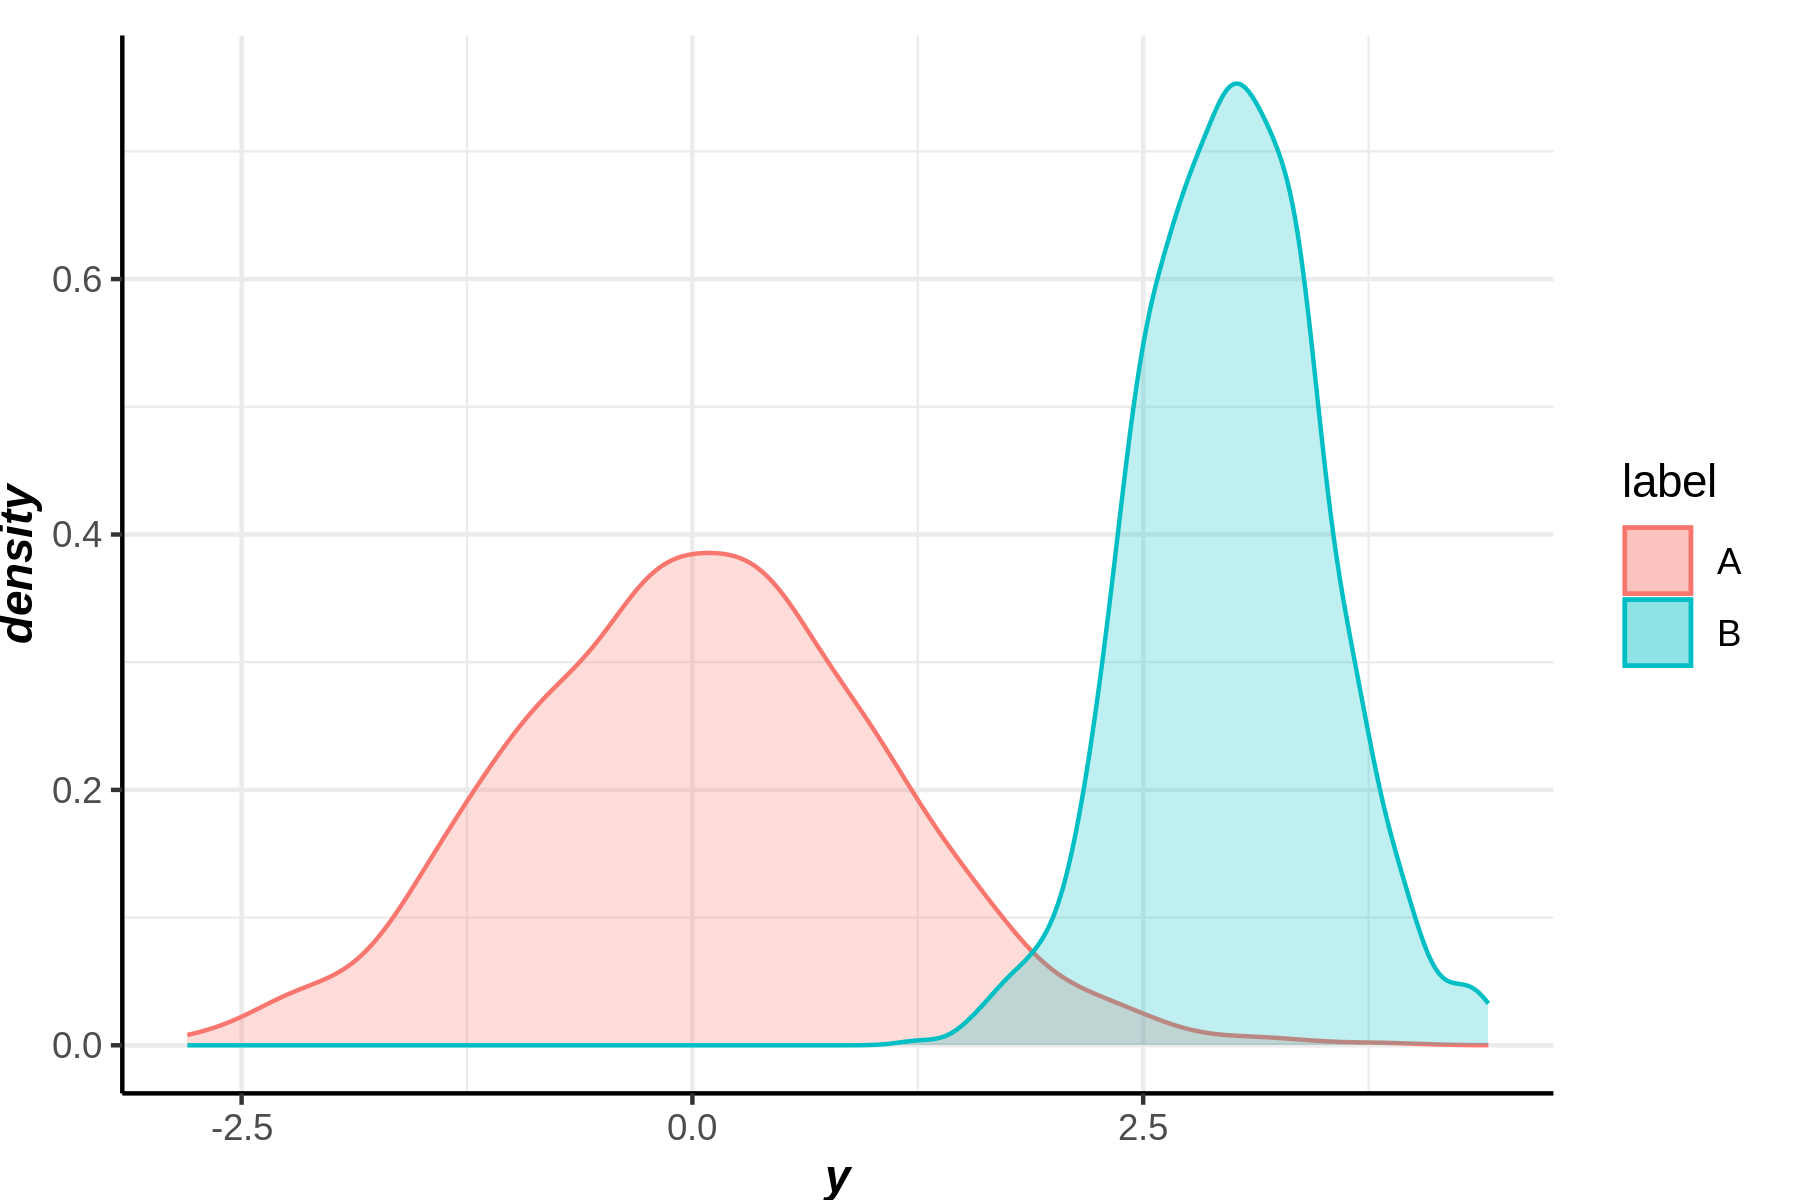
- 예시2
ggplot()+density(y1,label="A")+density(y2,label="B")
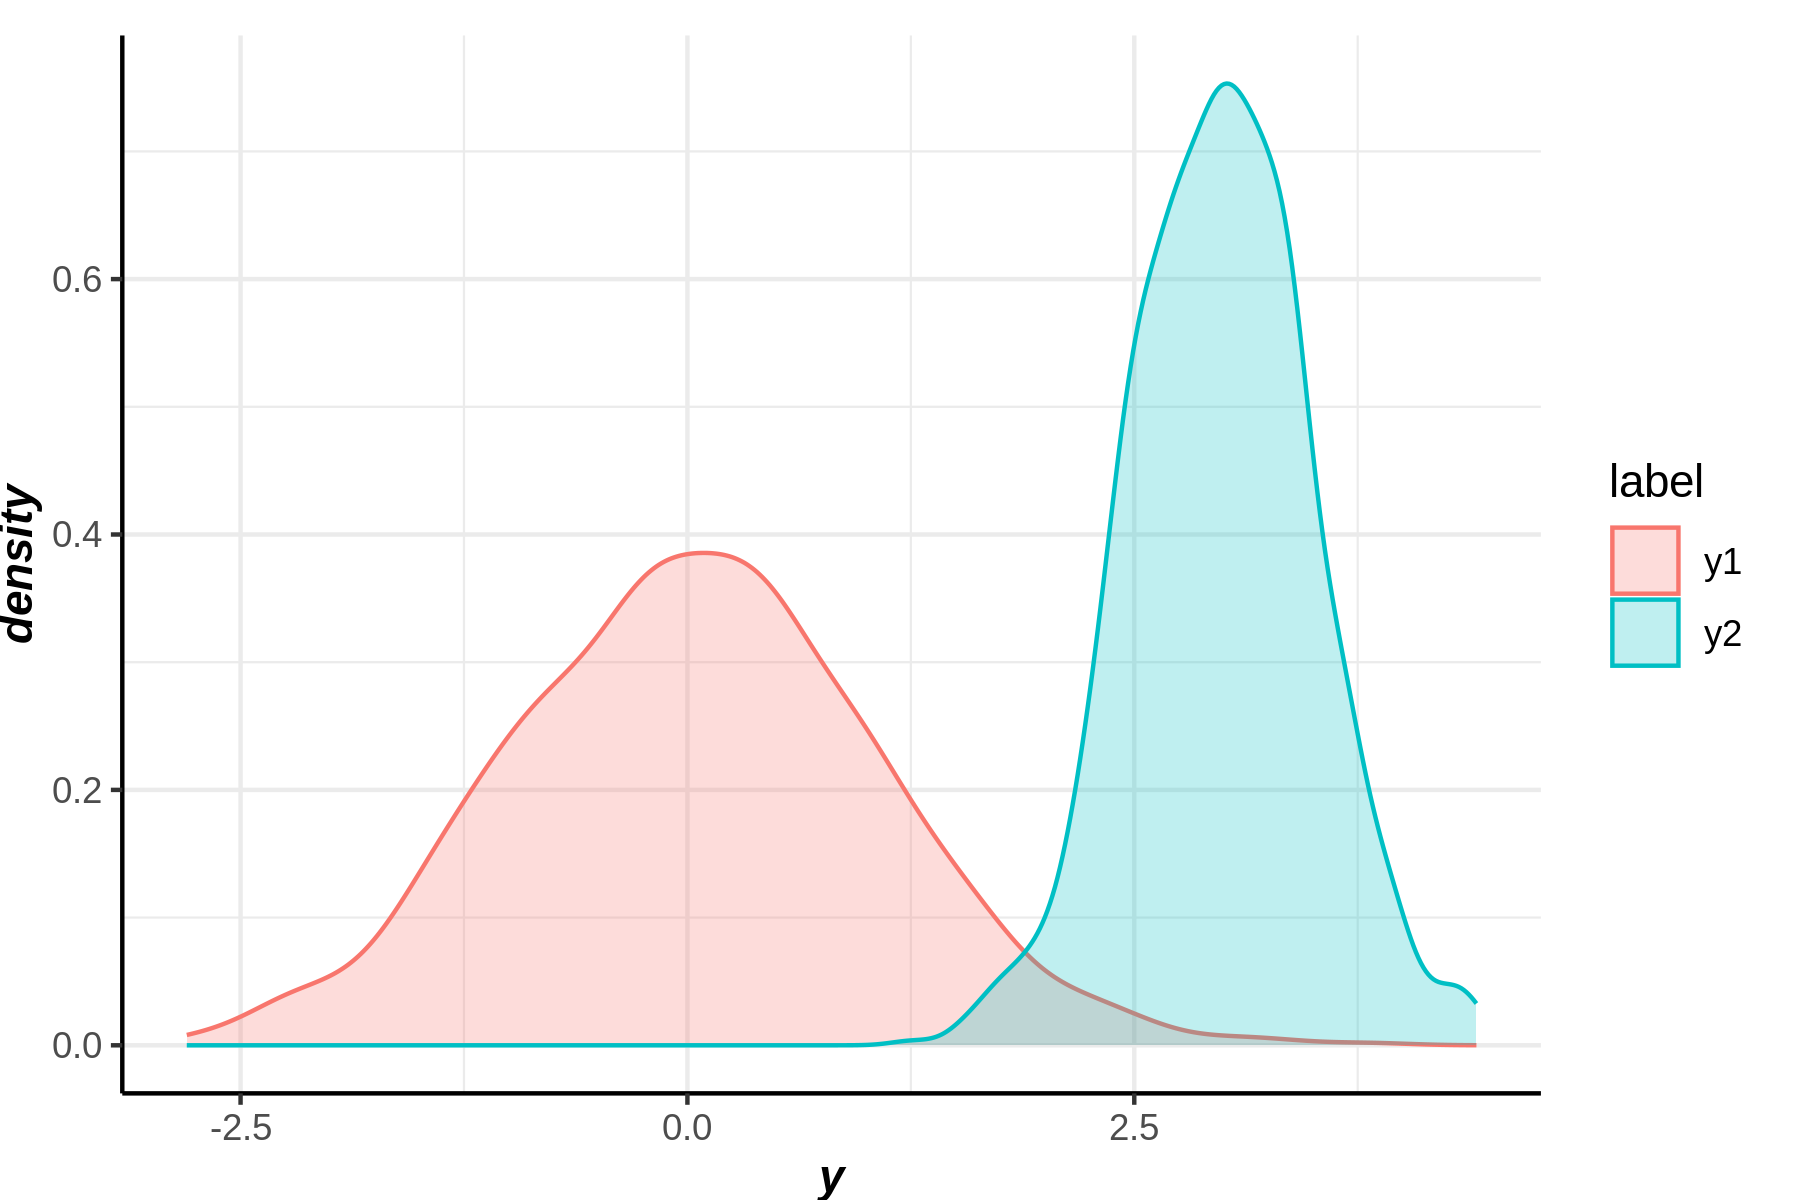
- 예시3
ggplot()+density(cbind(y1,y2))
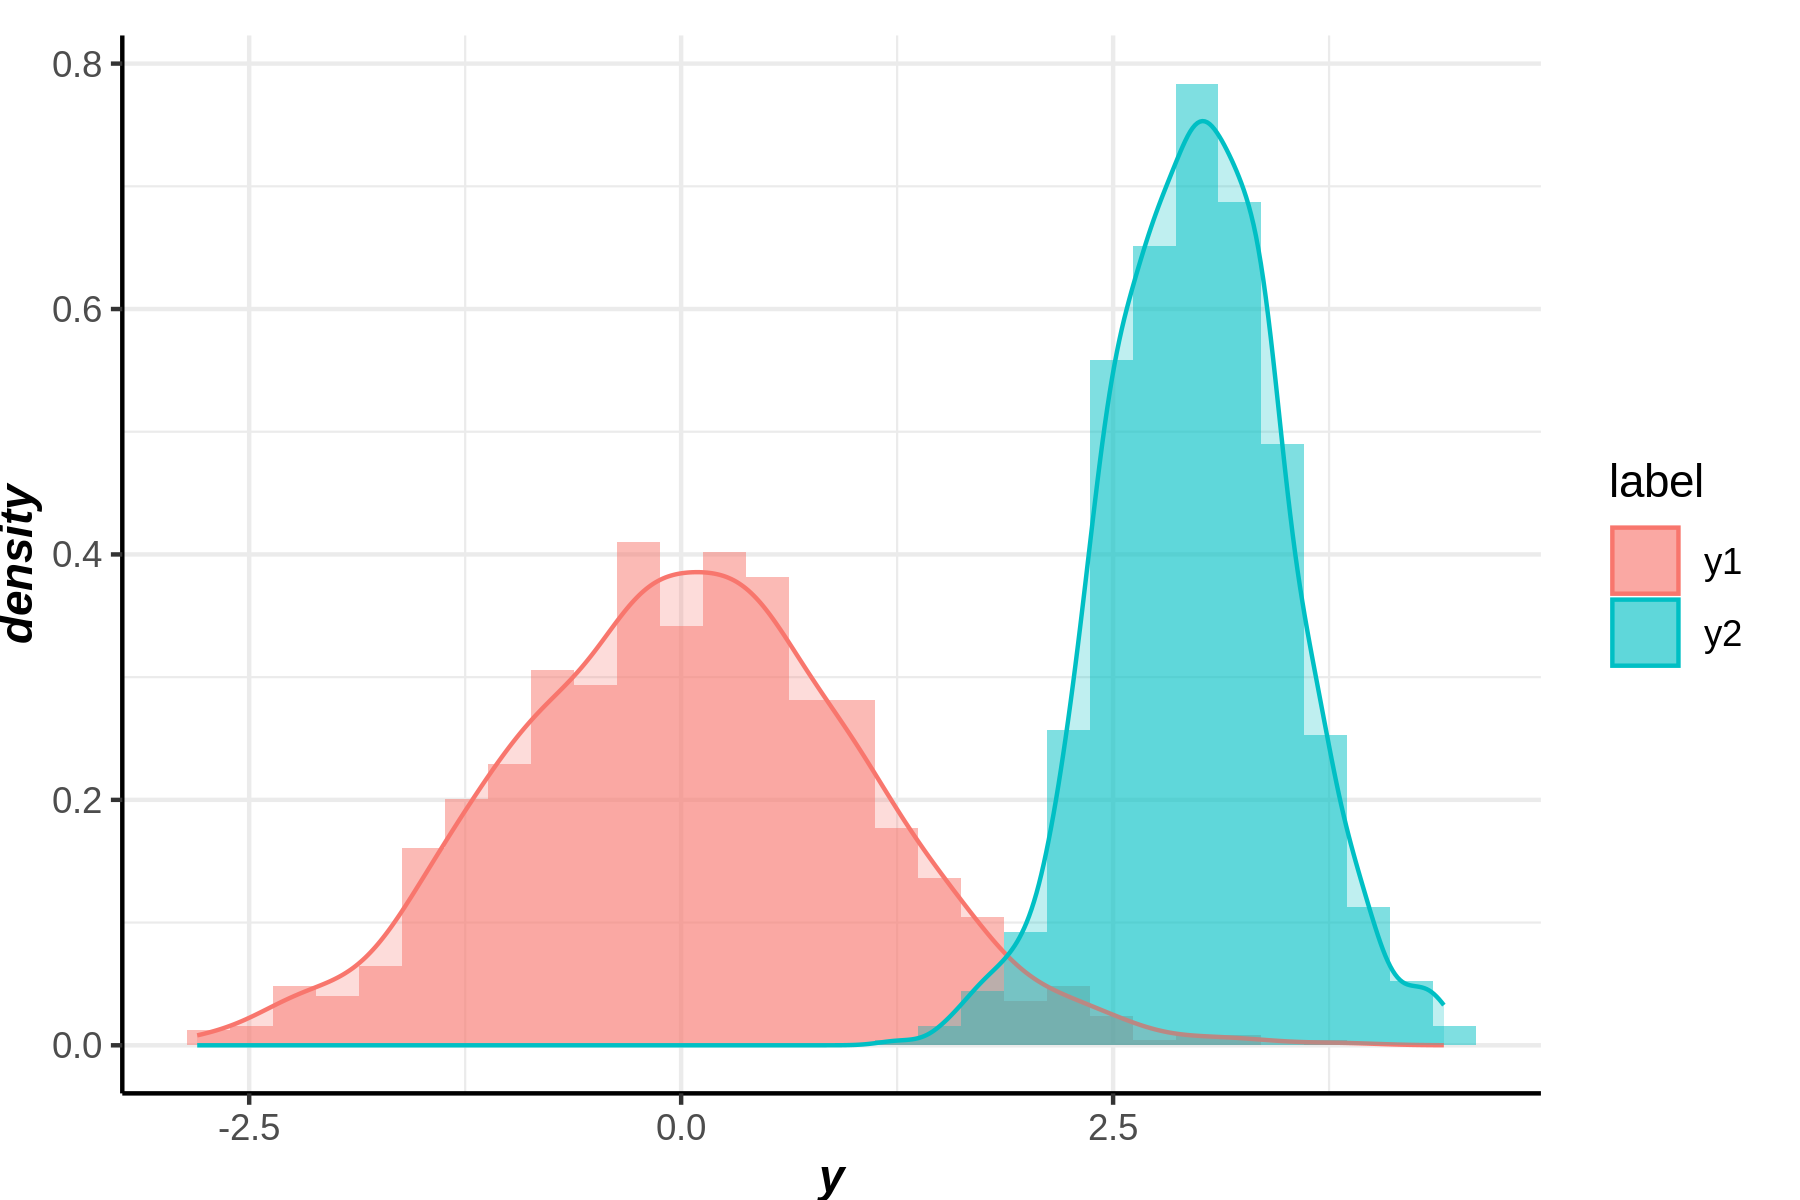
- 예시4
ggplot()+histogram(cbind(y1,y2))+density(cbind(y1,y2))
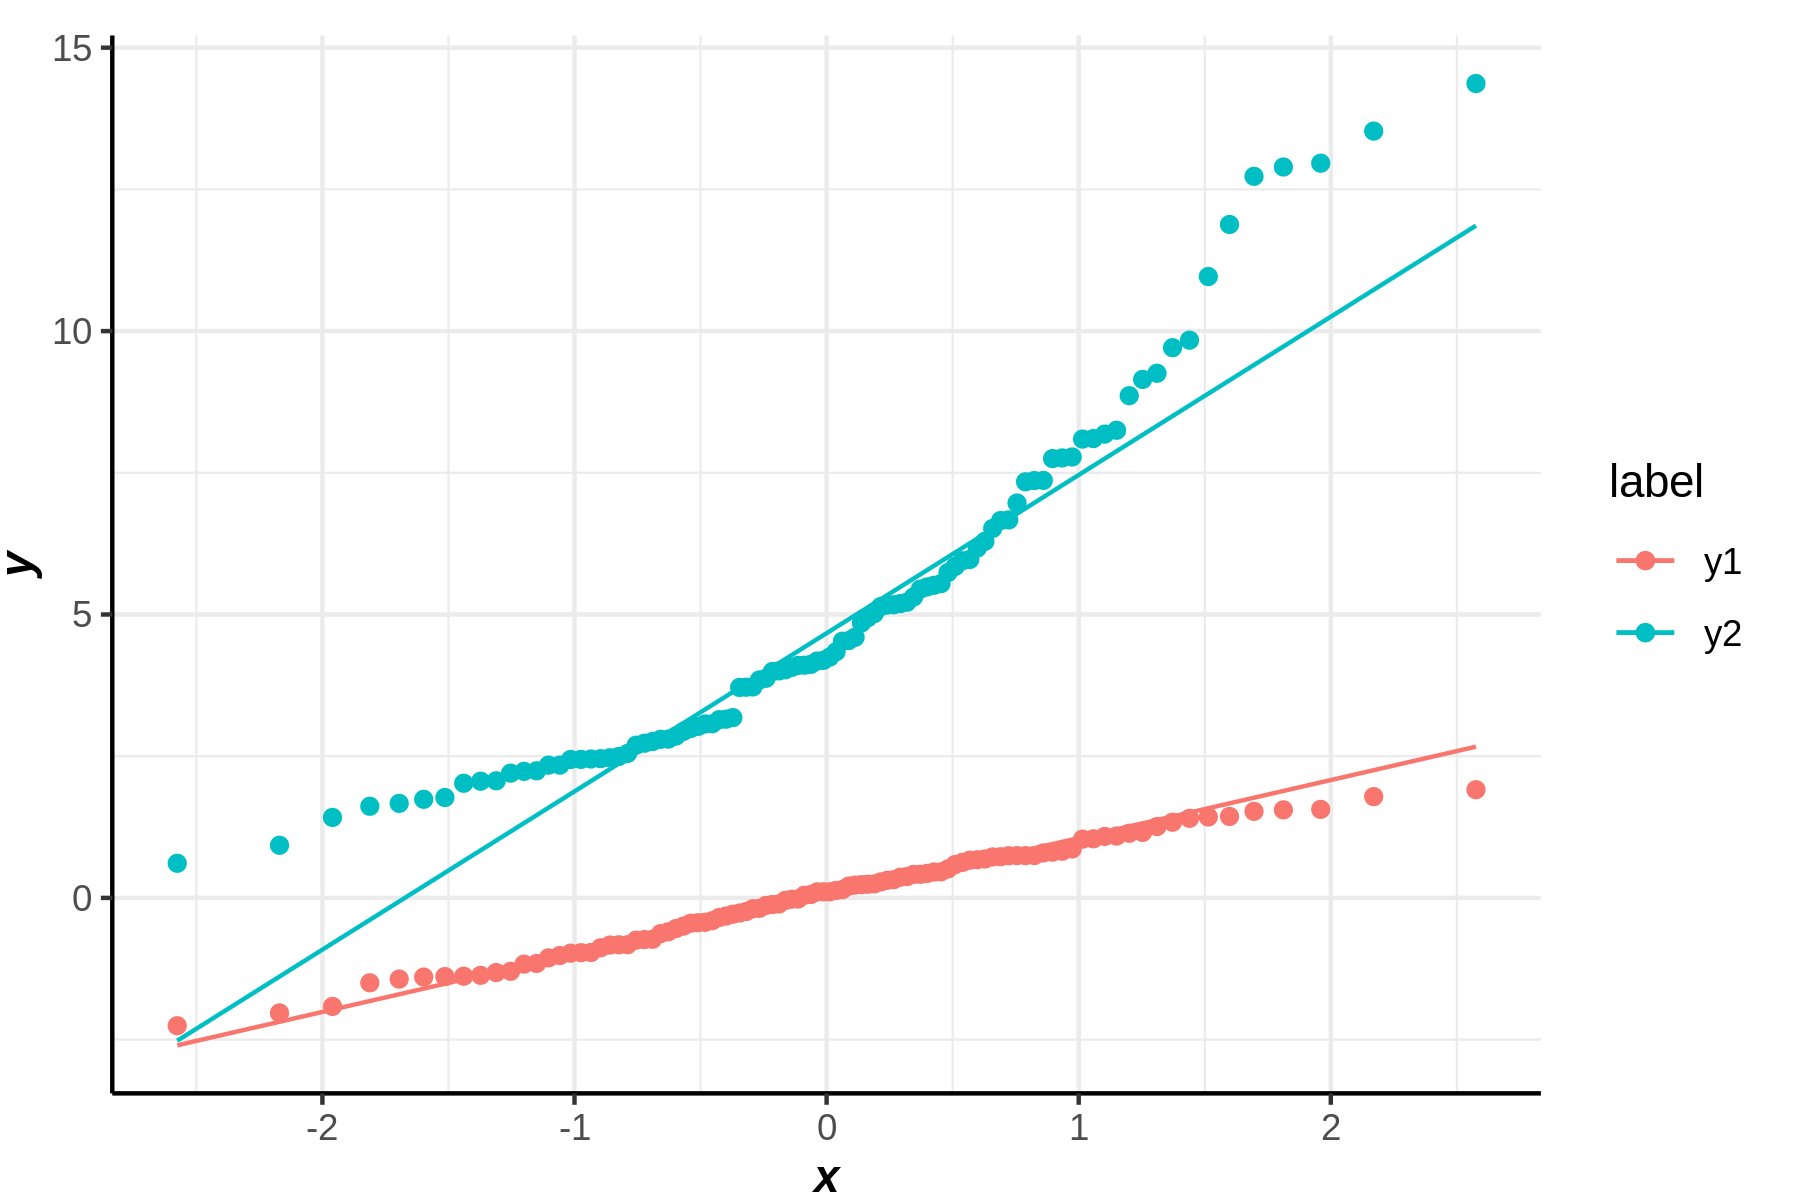
qq
y1 = rnorm(100)
y2 = rchisq(100,df=5)
ggplot()+
qq(y1,label='y1')+qq_line(y1,label='y1')+
qq(y2,label='y2')+qq_line(y2,label='y2')
geoms for comparison
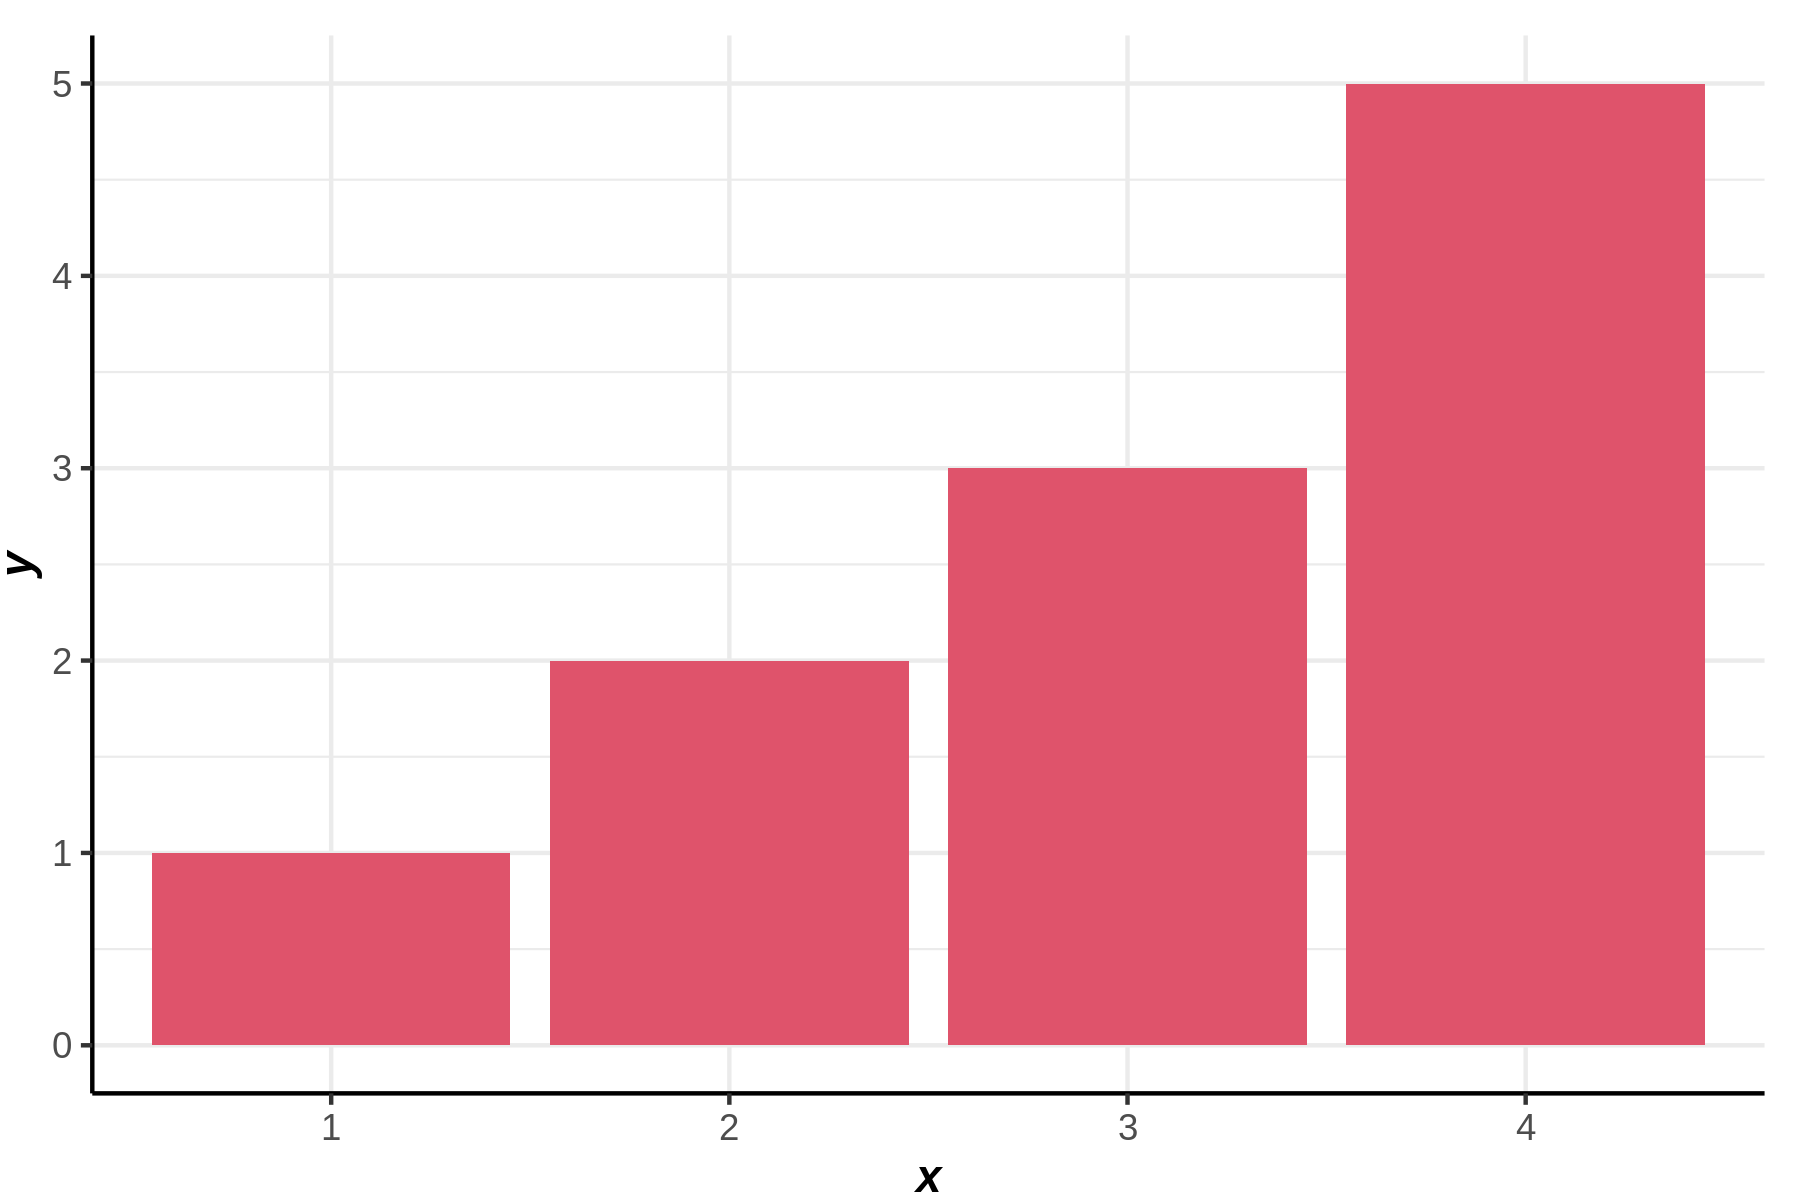
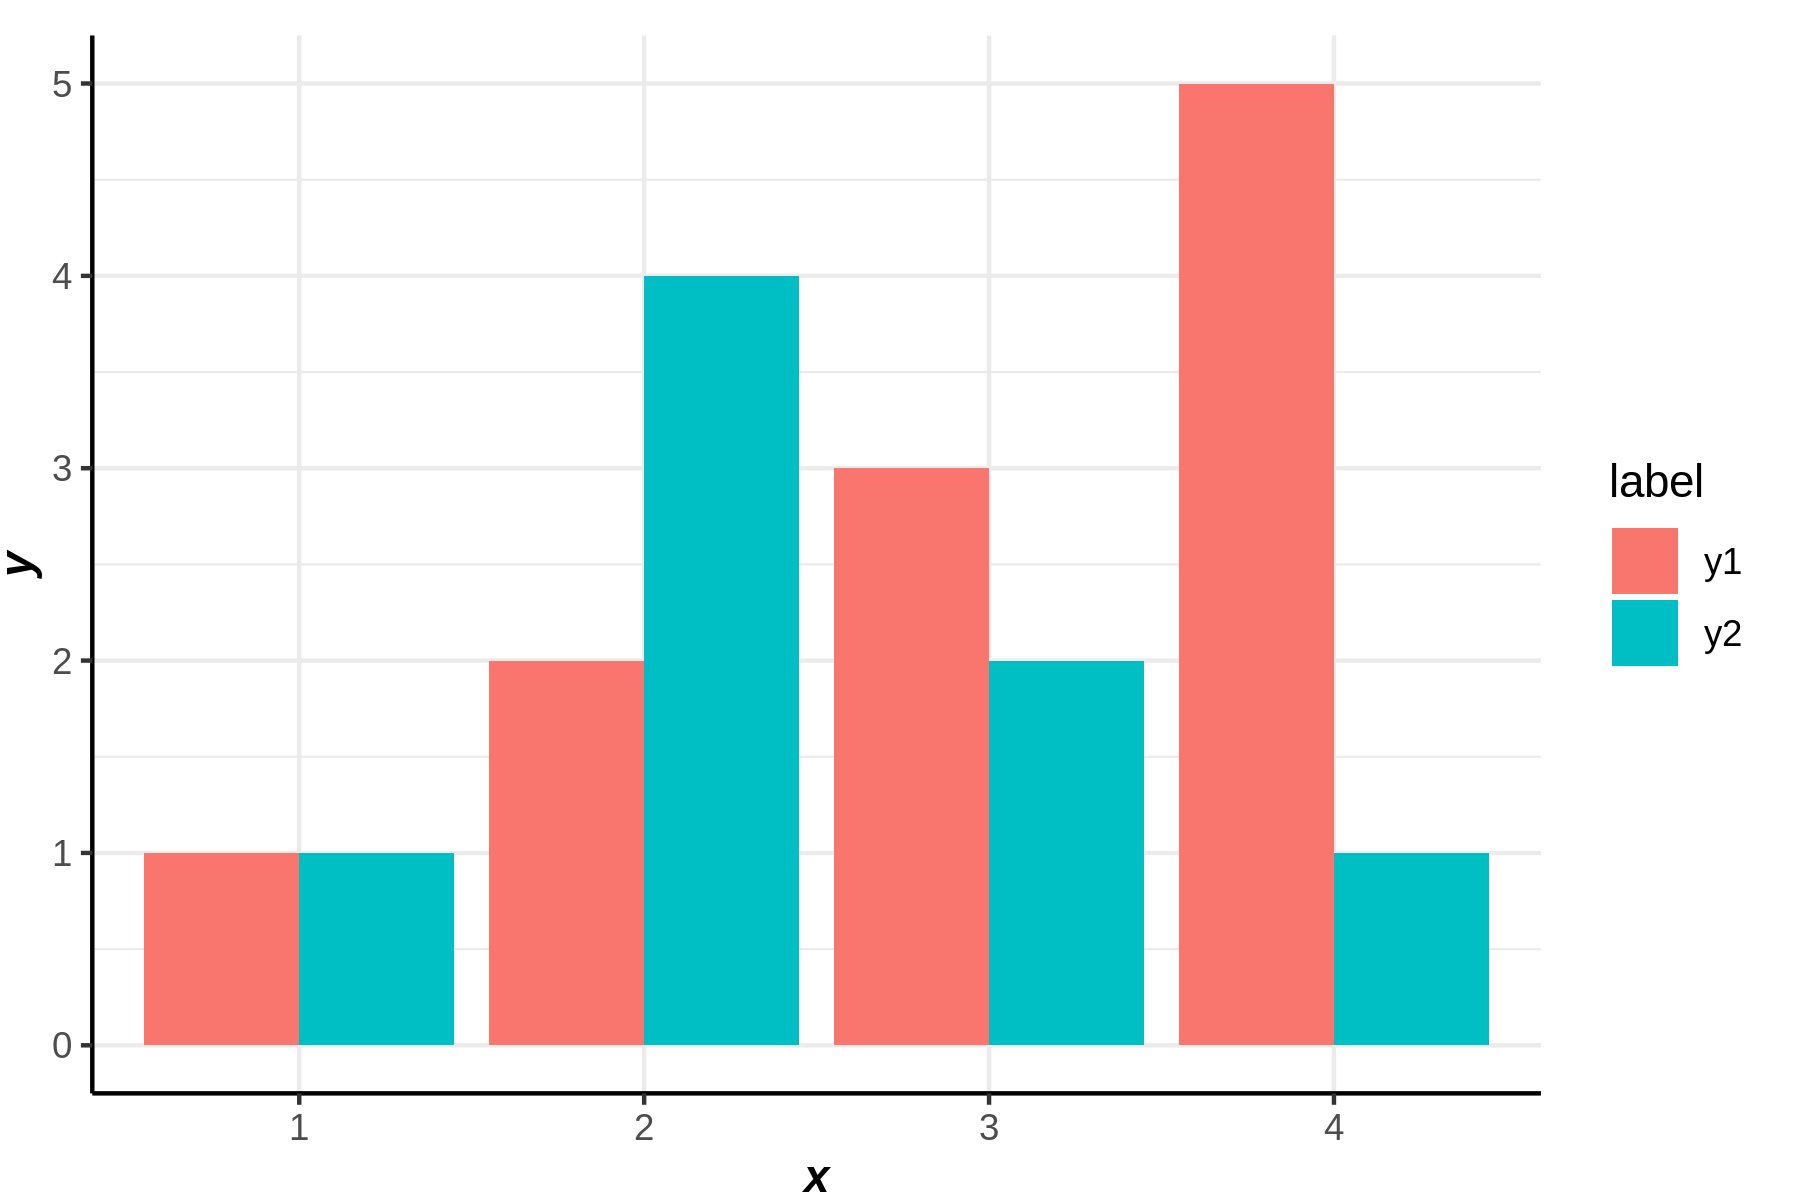
col
y1=c(1,2,3,5)
y2=c(1,4,2,1)
ggplot()+col(cbind(y1,y2))
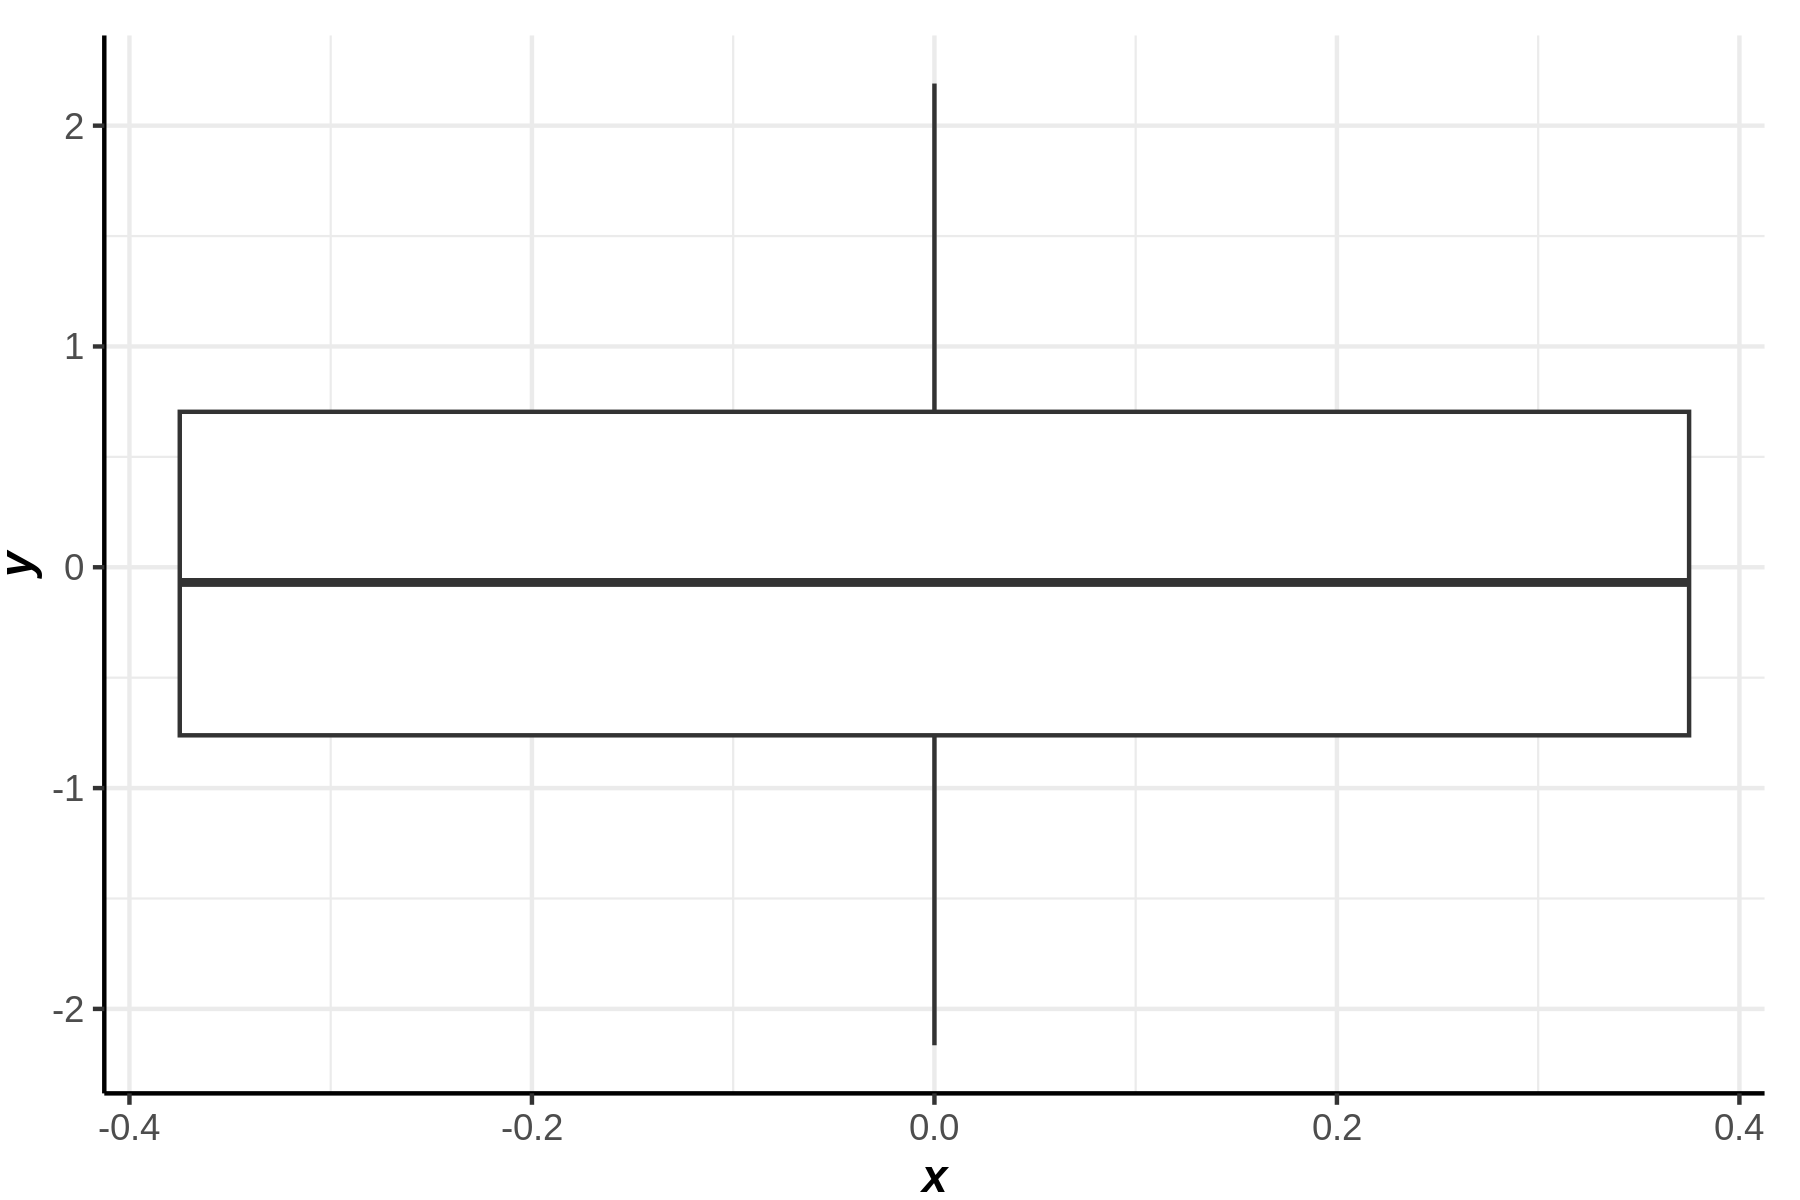
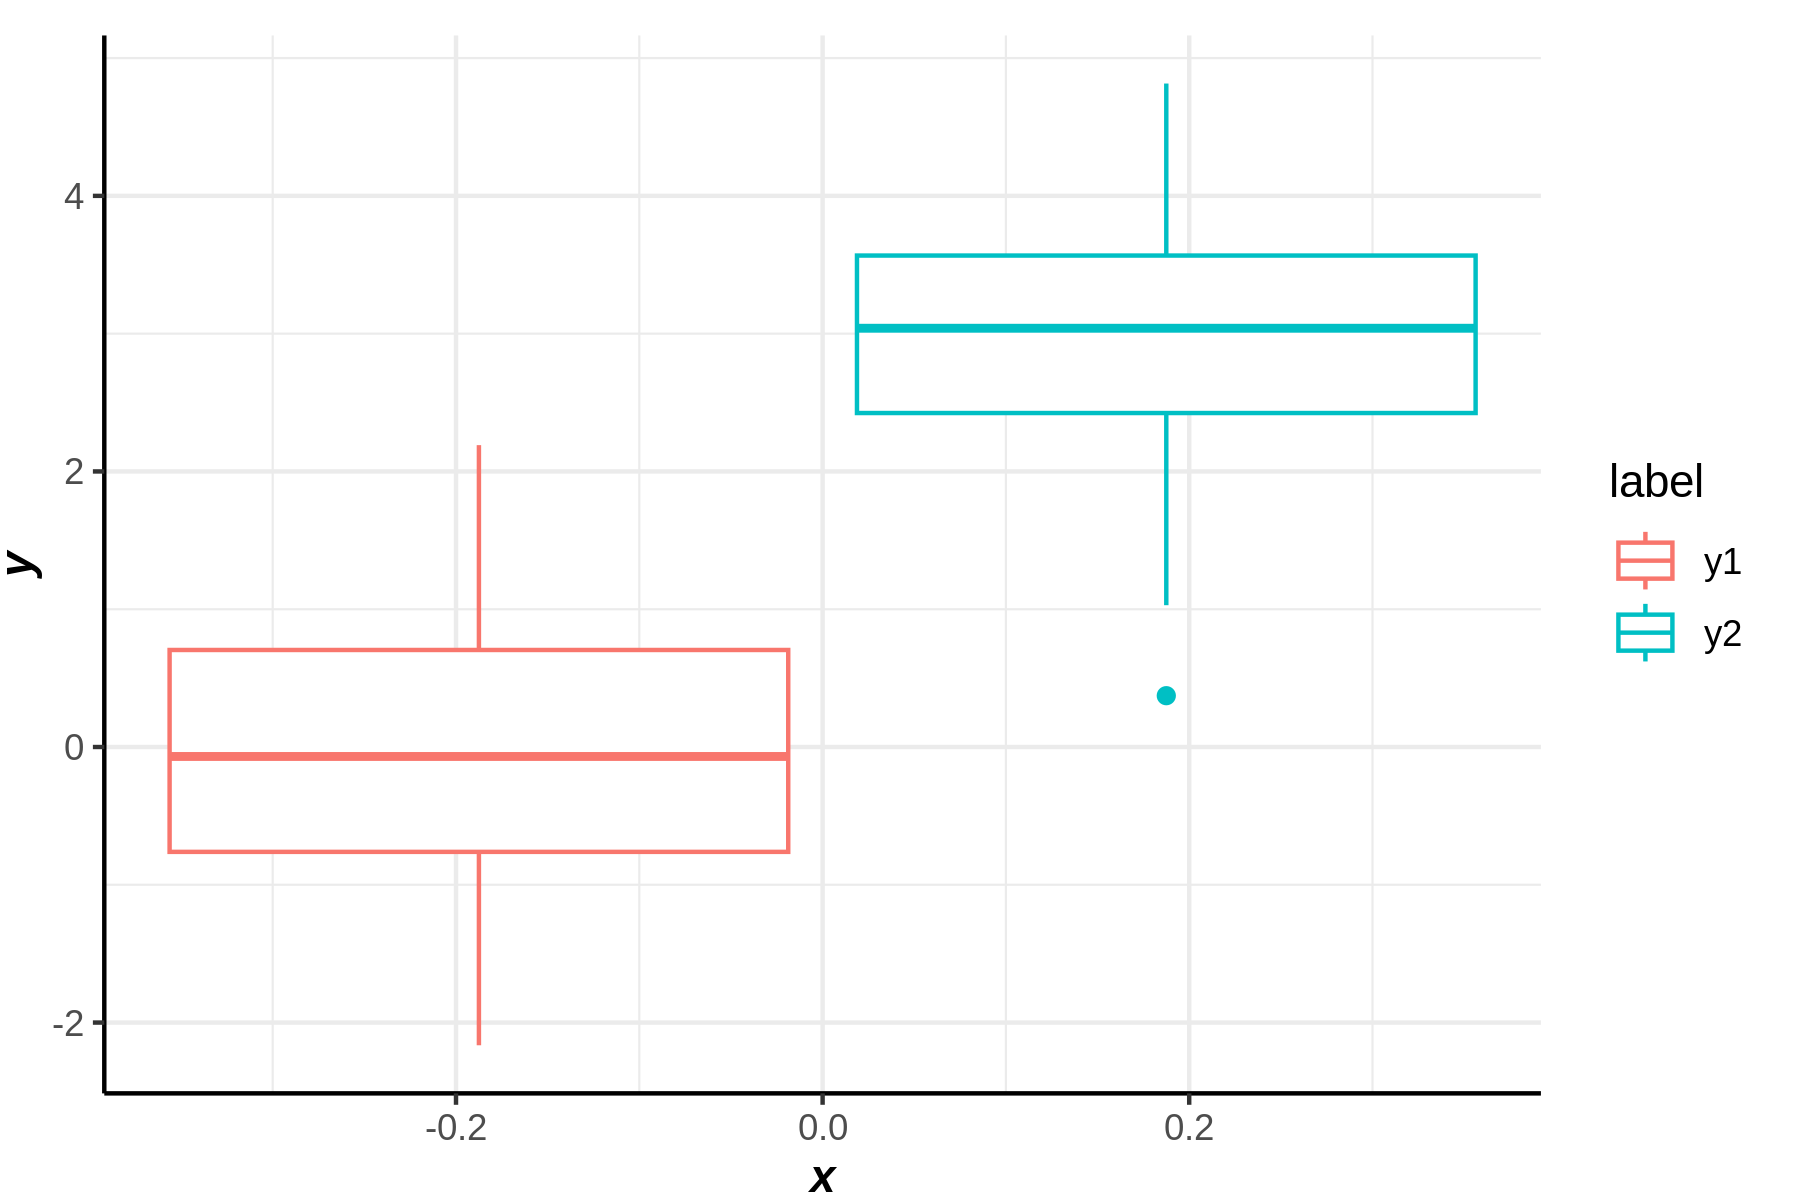
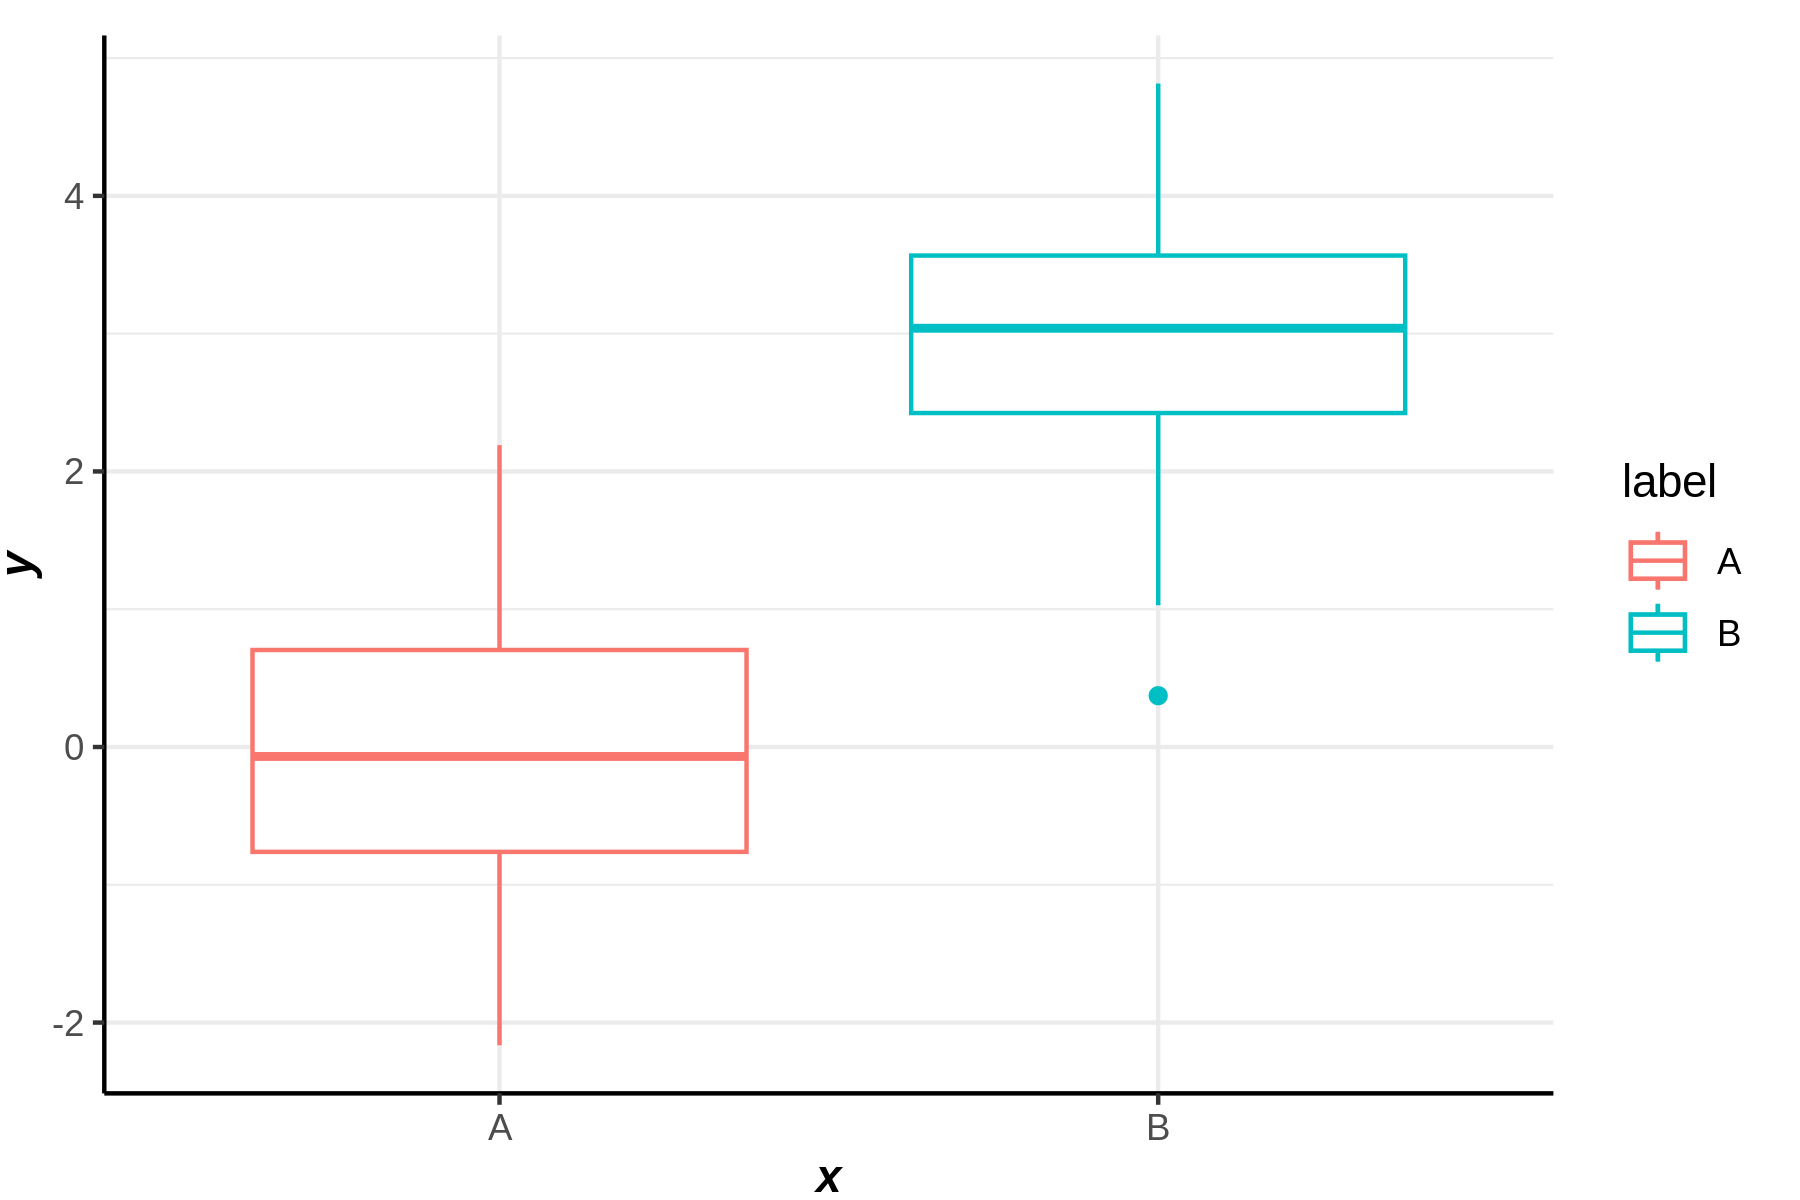
boxplot
y1=rnorm(100)
y2=rnorm(100)+3
- 예시1
- 예시2
ggplot()+boxplot(cbind(y1,y2))
- 예시3
ggplot()+boxplot(x='A',y1,label='A')+boxplot(x='B',y2,label='B')
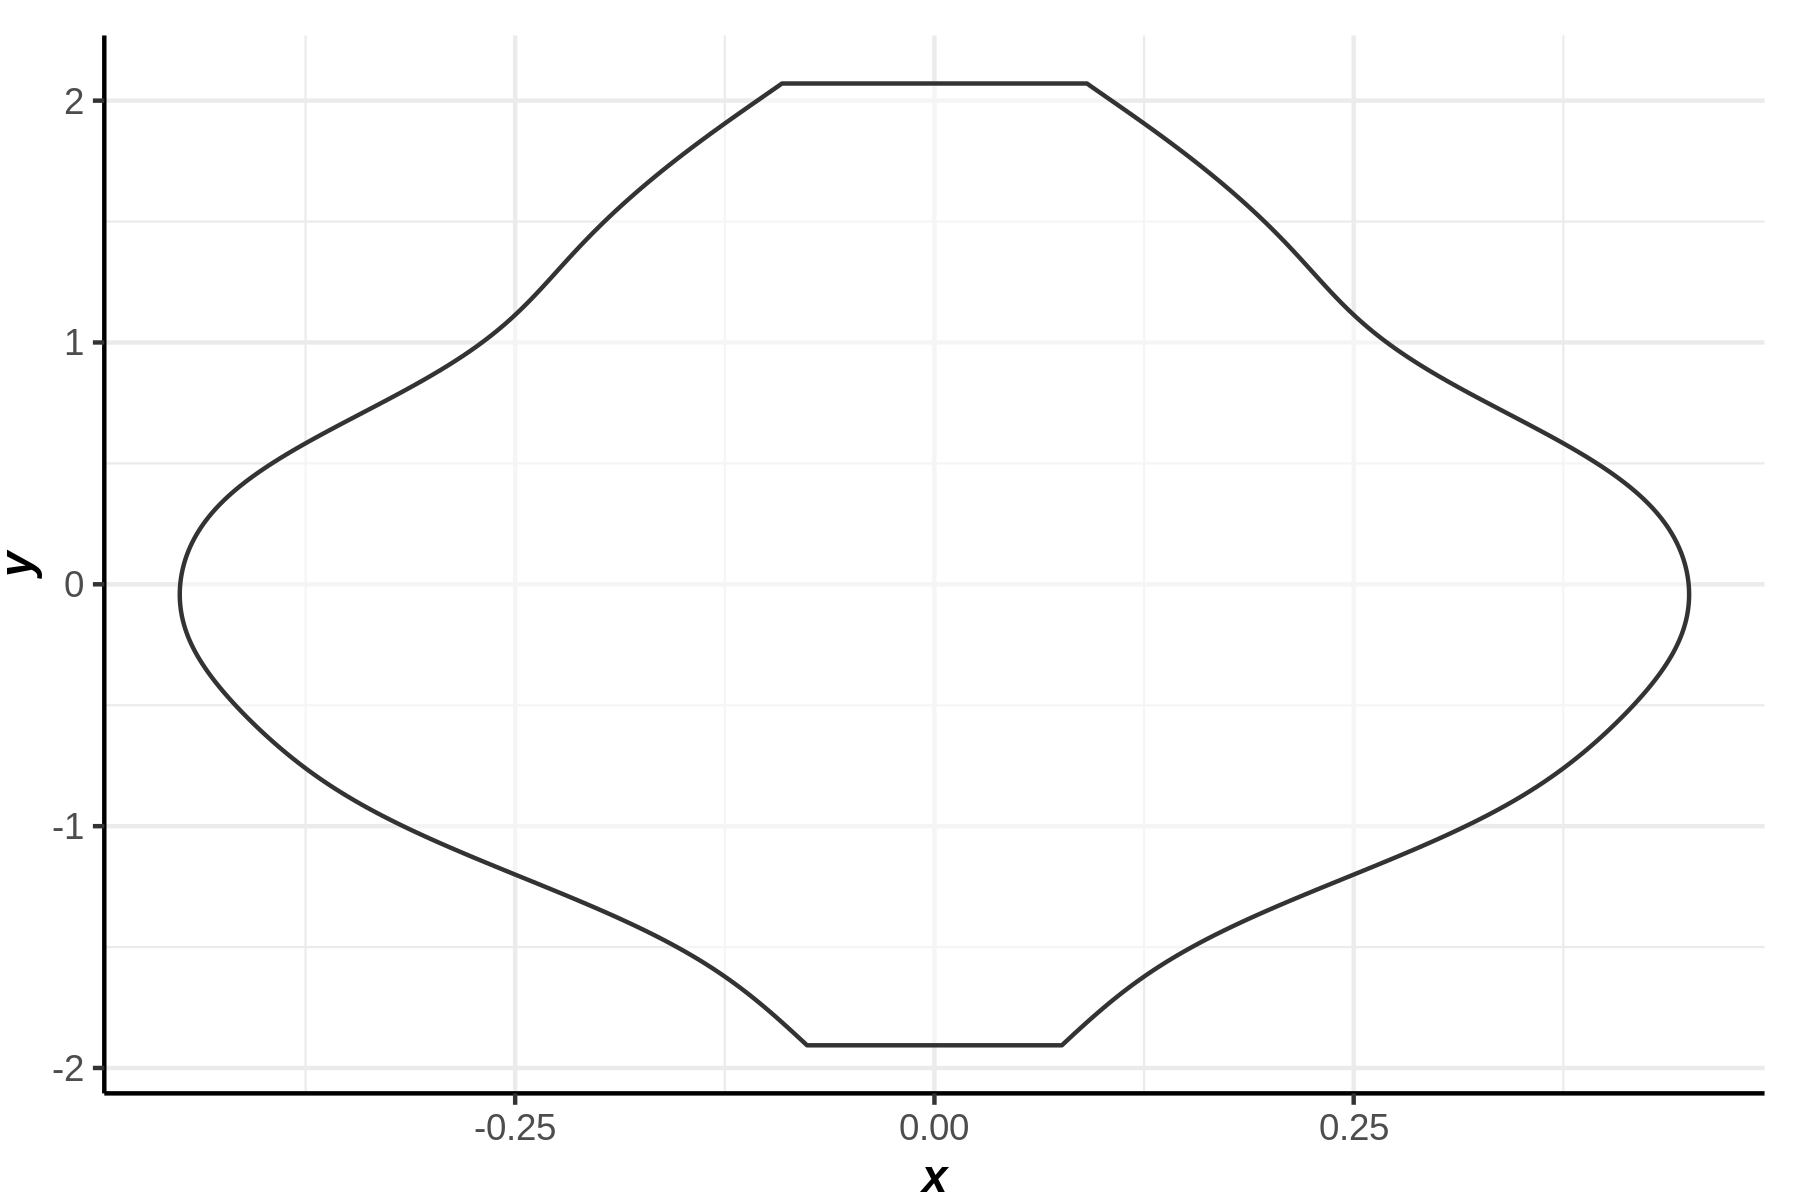
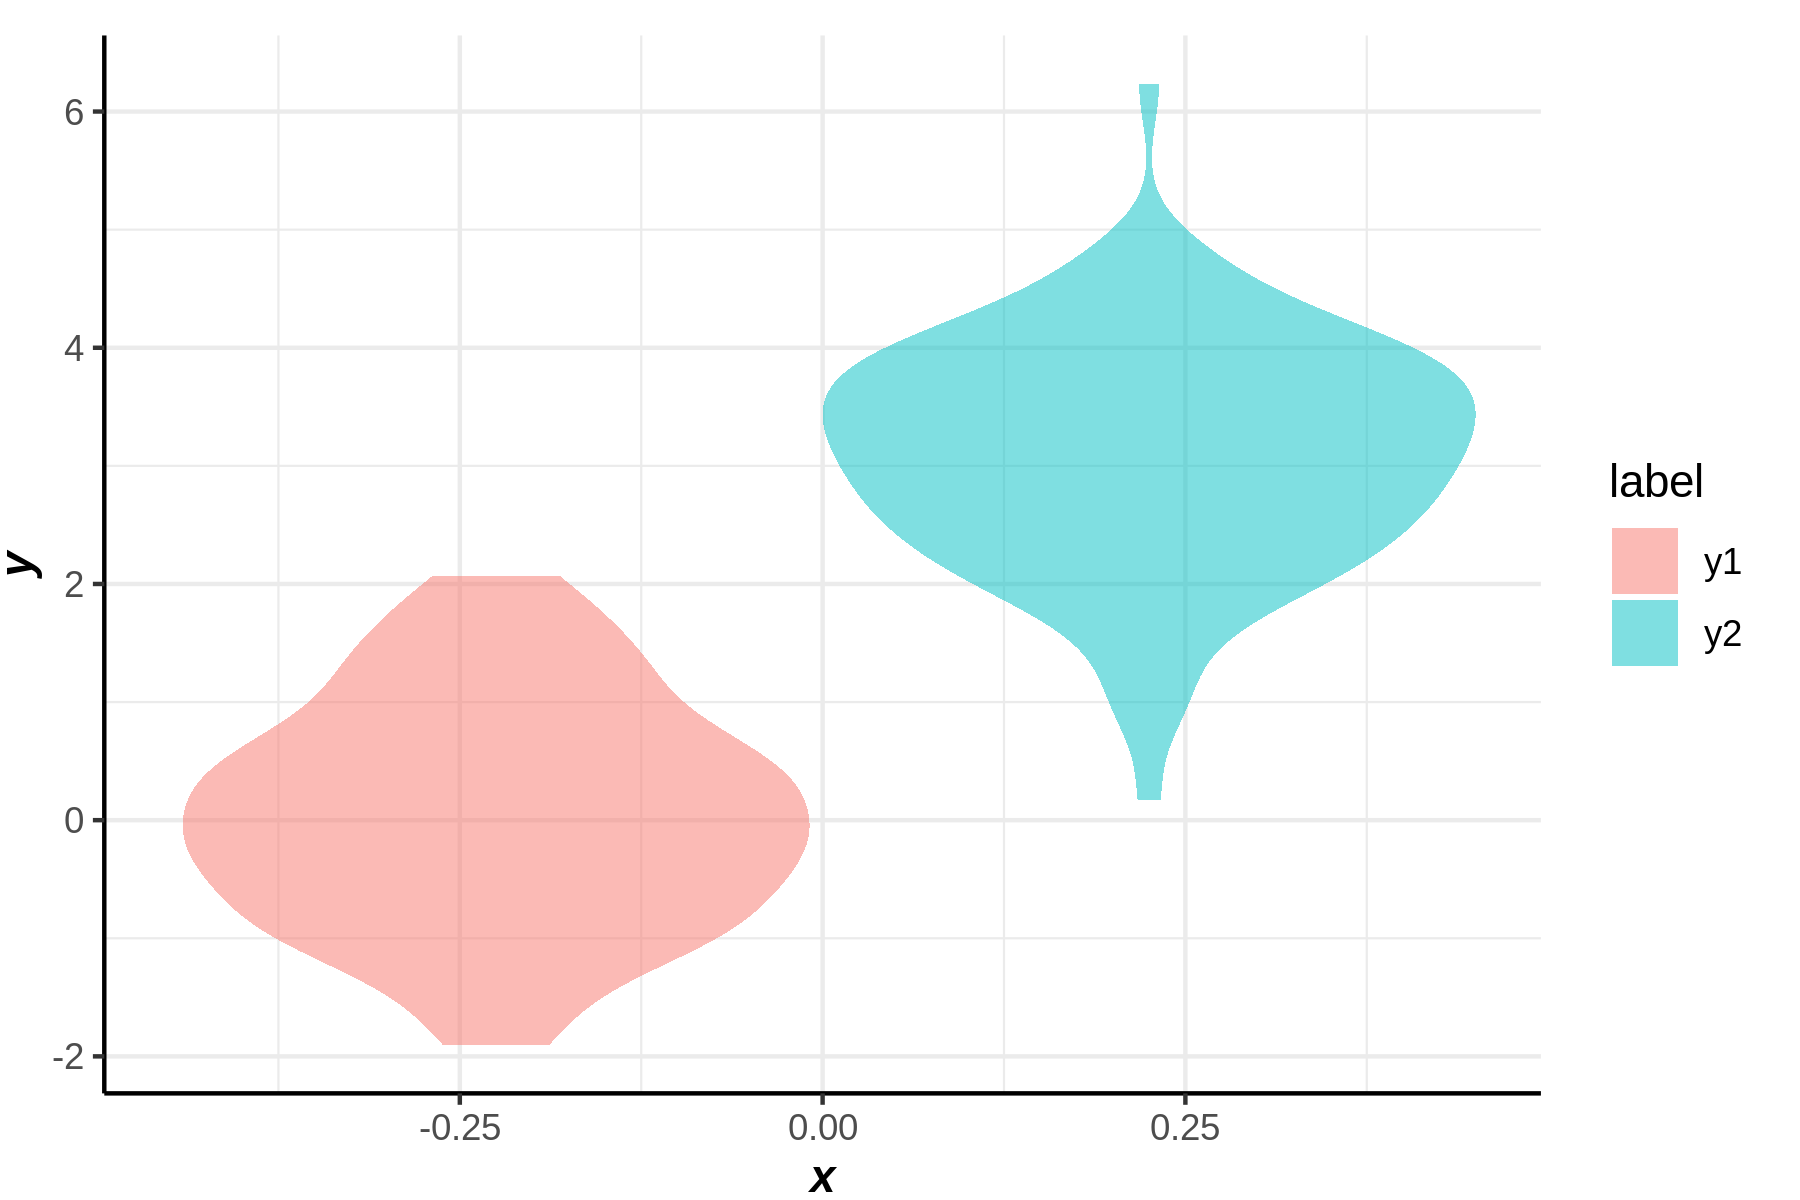
violin
y1=rnorm(100)
y2=rnorm(100)+3
- 예시1
- 예시2
ggplot()+violin(cbind(y1,y2), color = "transparent")
- 예시3
ggplot()+violin(x='A',y1,label='A')+violin(x='B',y2,label='B')