\(b\)가 컬럼 스페이스가 아닌 다른 공간인 left null space에 존재하면 \(0\)이 된다.
\(p\) = projection, \(e\) = error, \(b\) = a vector
\(p\)는 columns space 에 있고
\(e\)는 left null space 에 있다.
\(P\) = symmetric \(\to\)\((I-P)\) = symmetric
\(P\) = projection \(\to\)\((I-P)\) = projection
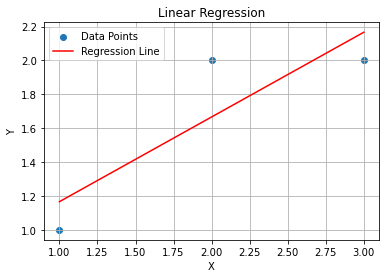
- Least Square Method
# 주어진 데이터 포인트data = [(1, 1), (2, 2), (3, 2)]x_data = [d[0] for d in data]y_data = [d[1] for d in data]# 다항 회귀를 위해 데이터를 변형합니다.x = np.array(x_data)y = np.array(y_data)# 다항 회귀를 위한 최소자승법을 사용하여 회귀선을 구합니다.coefficients = np.polyfit(x, y, 1) # 1차 다항식을 사용합니다.# 다항식 생성p = np.poly1d(coefficients)# 회귀선 그리기plt.scatter(x, y, label='Data Points')plt.plot(x, p(x), color='red', label='Regression Line')plt.xlabel('X')plt.ylabel('Y')plt.title('Linear Regression')plt.legend()plt.grid(True)plt.show()