with plt.style.context('seaborn-white'):
# plt.rcParams['font.family'] = 'xkcd'
# plt.xkcd(scale=0,length=200)
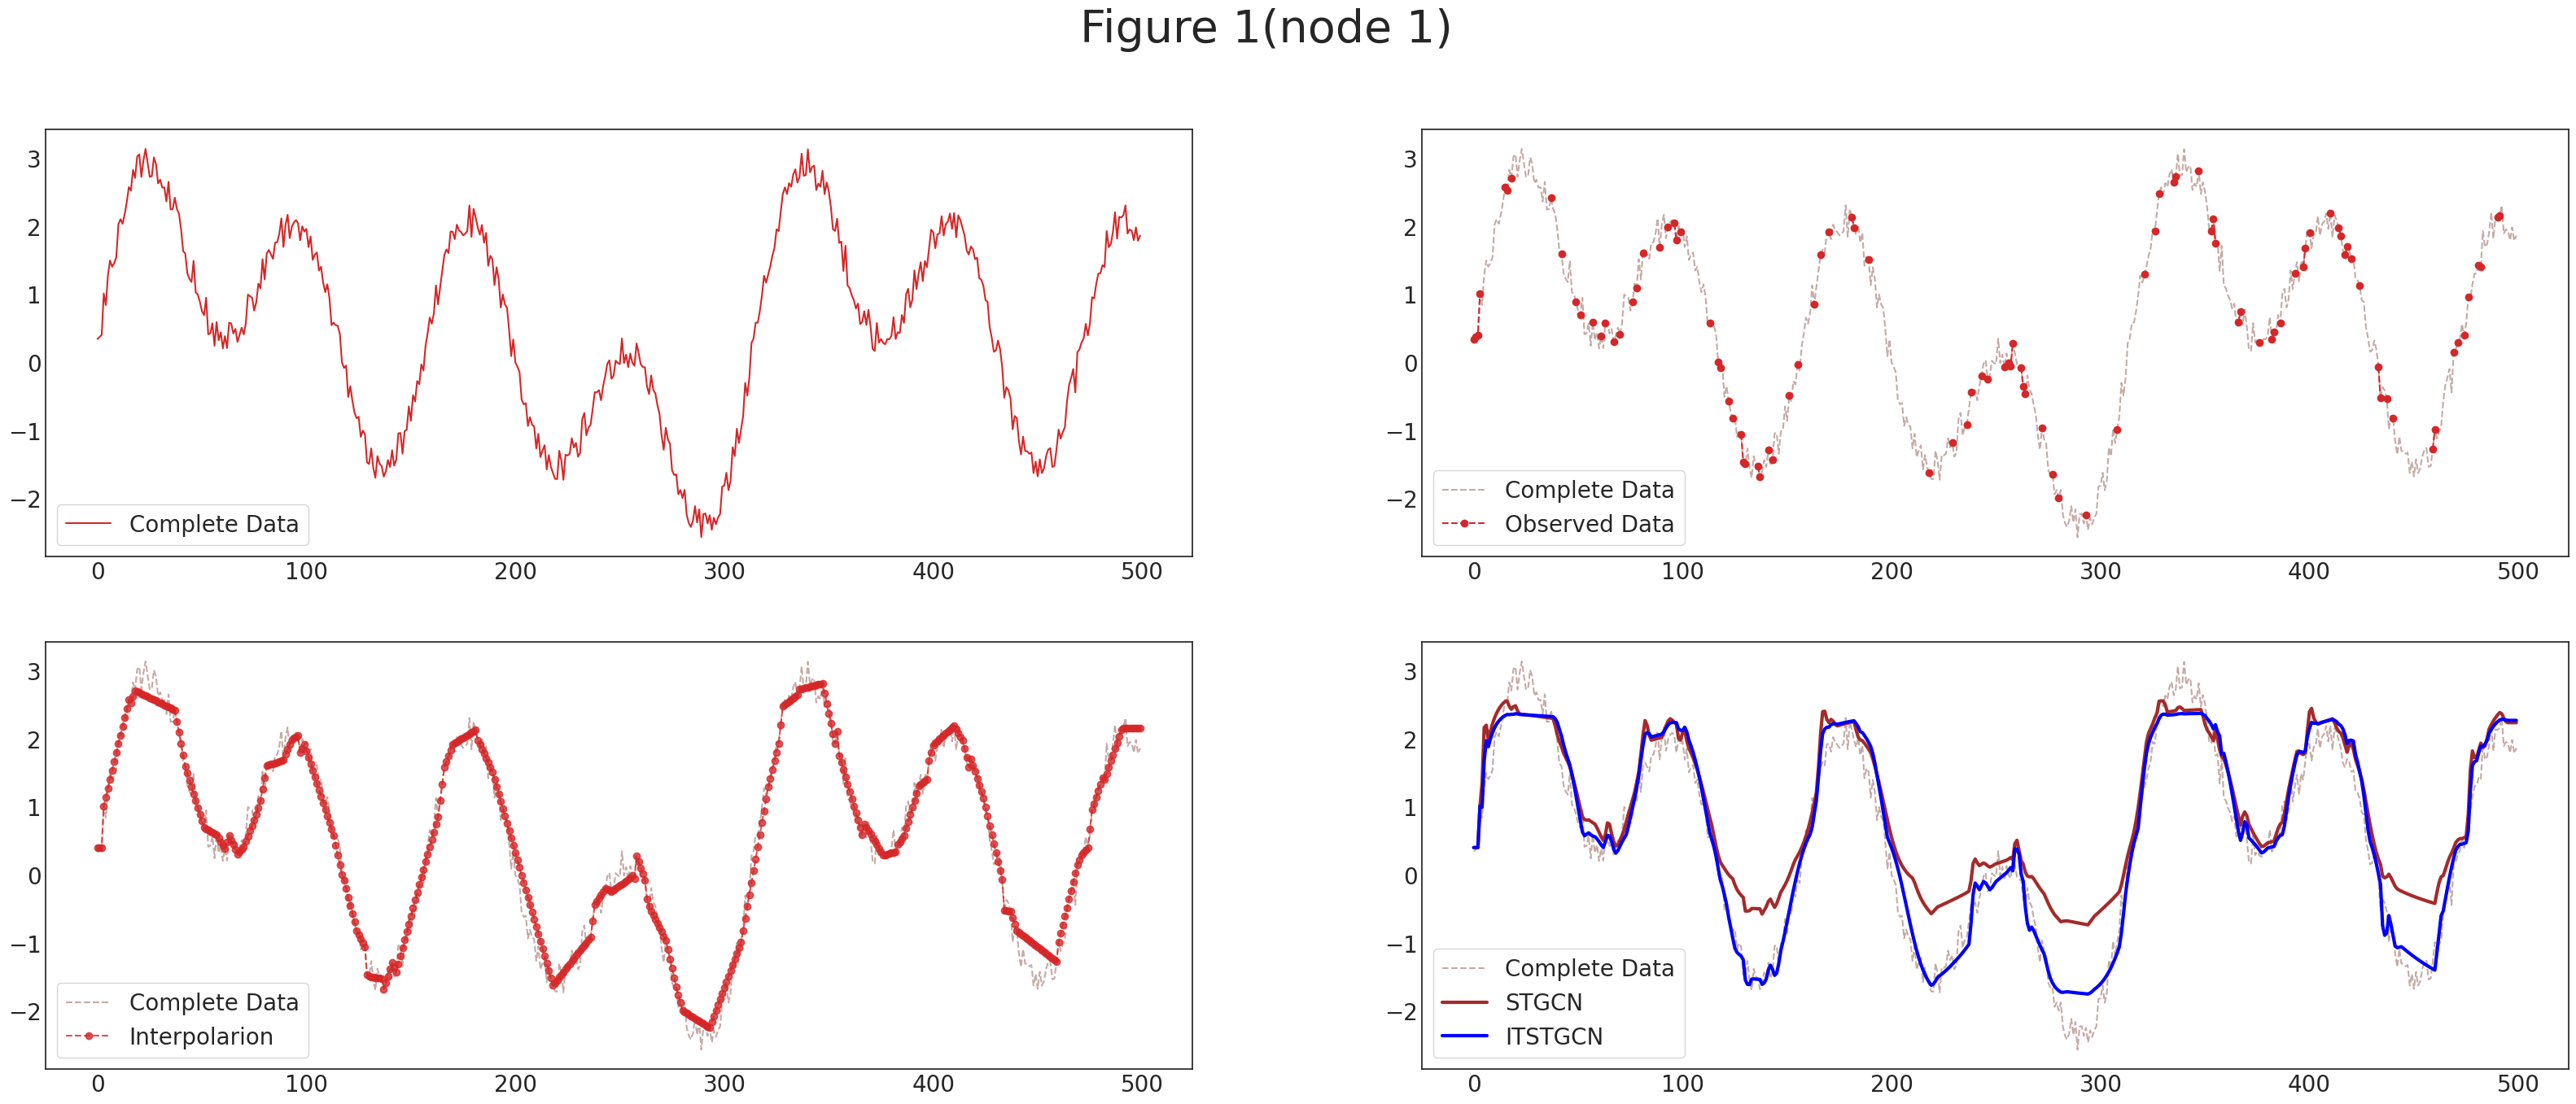
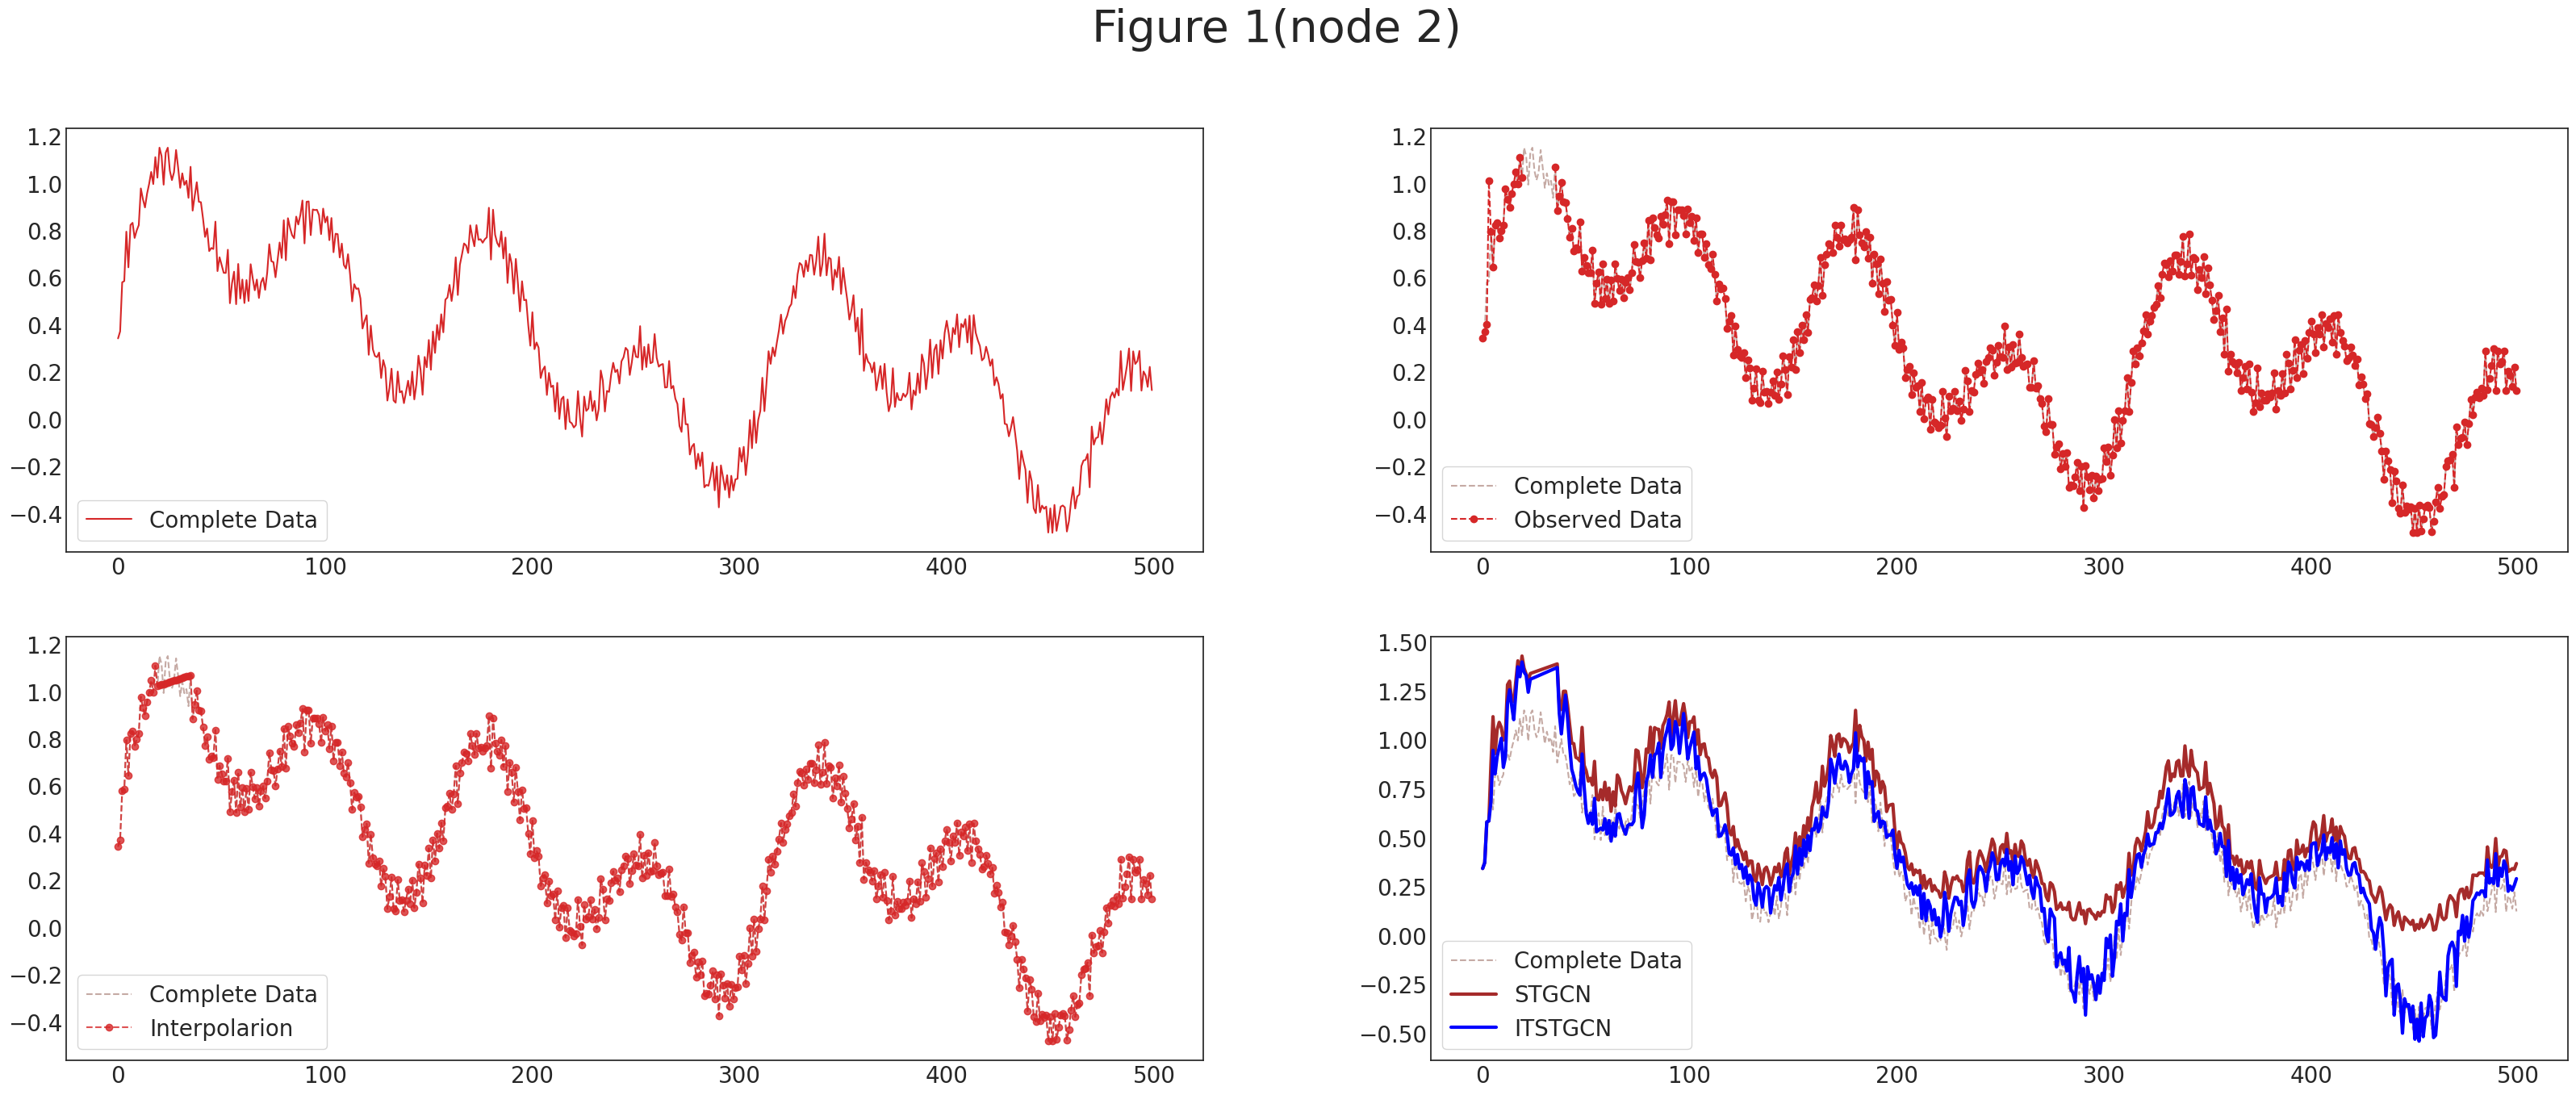
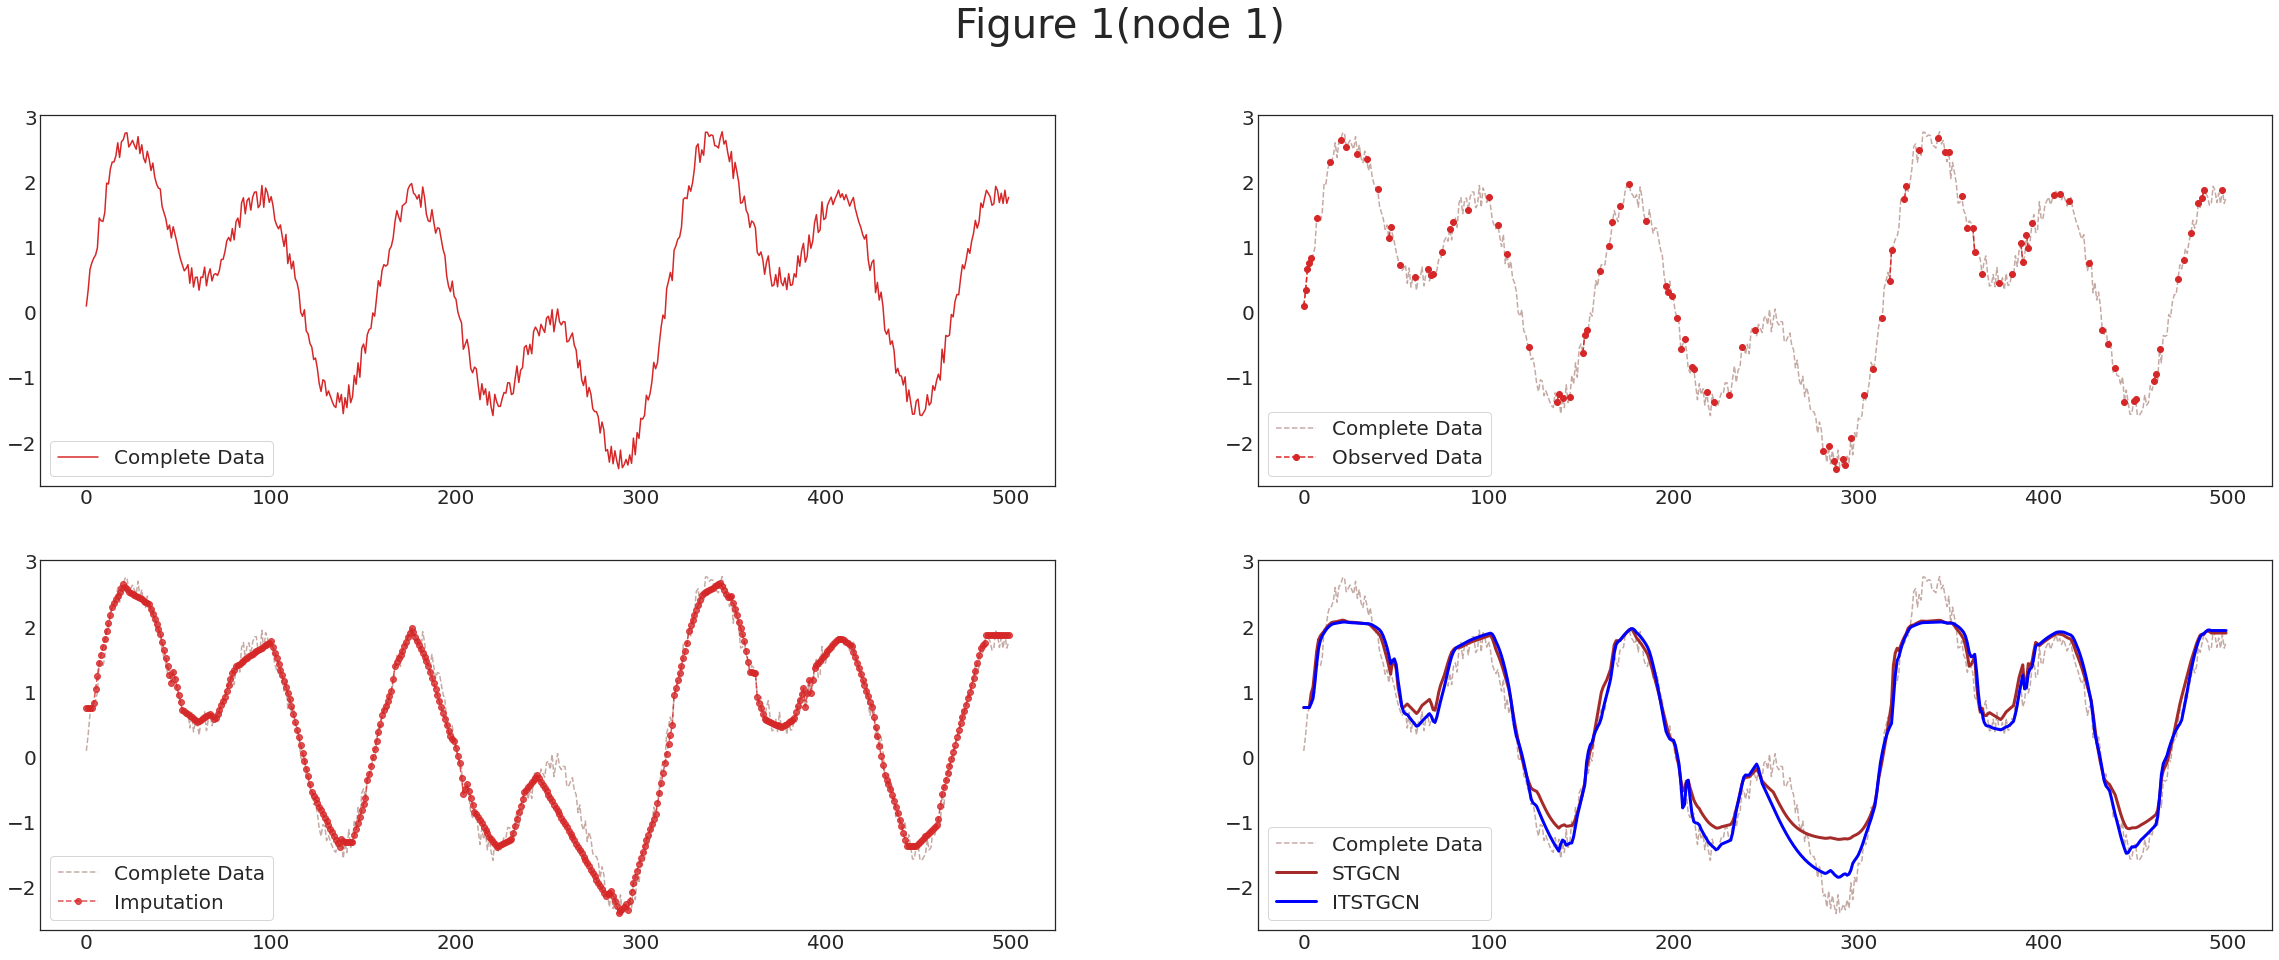
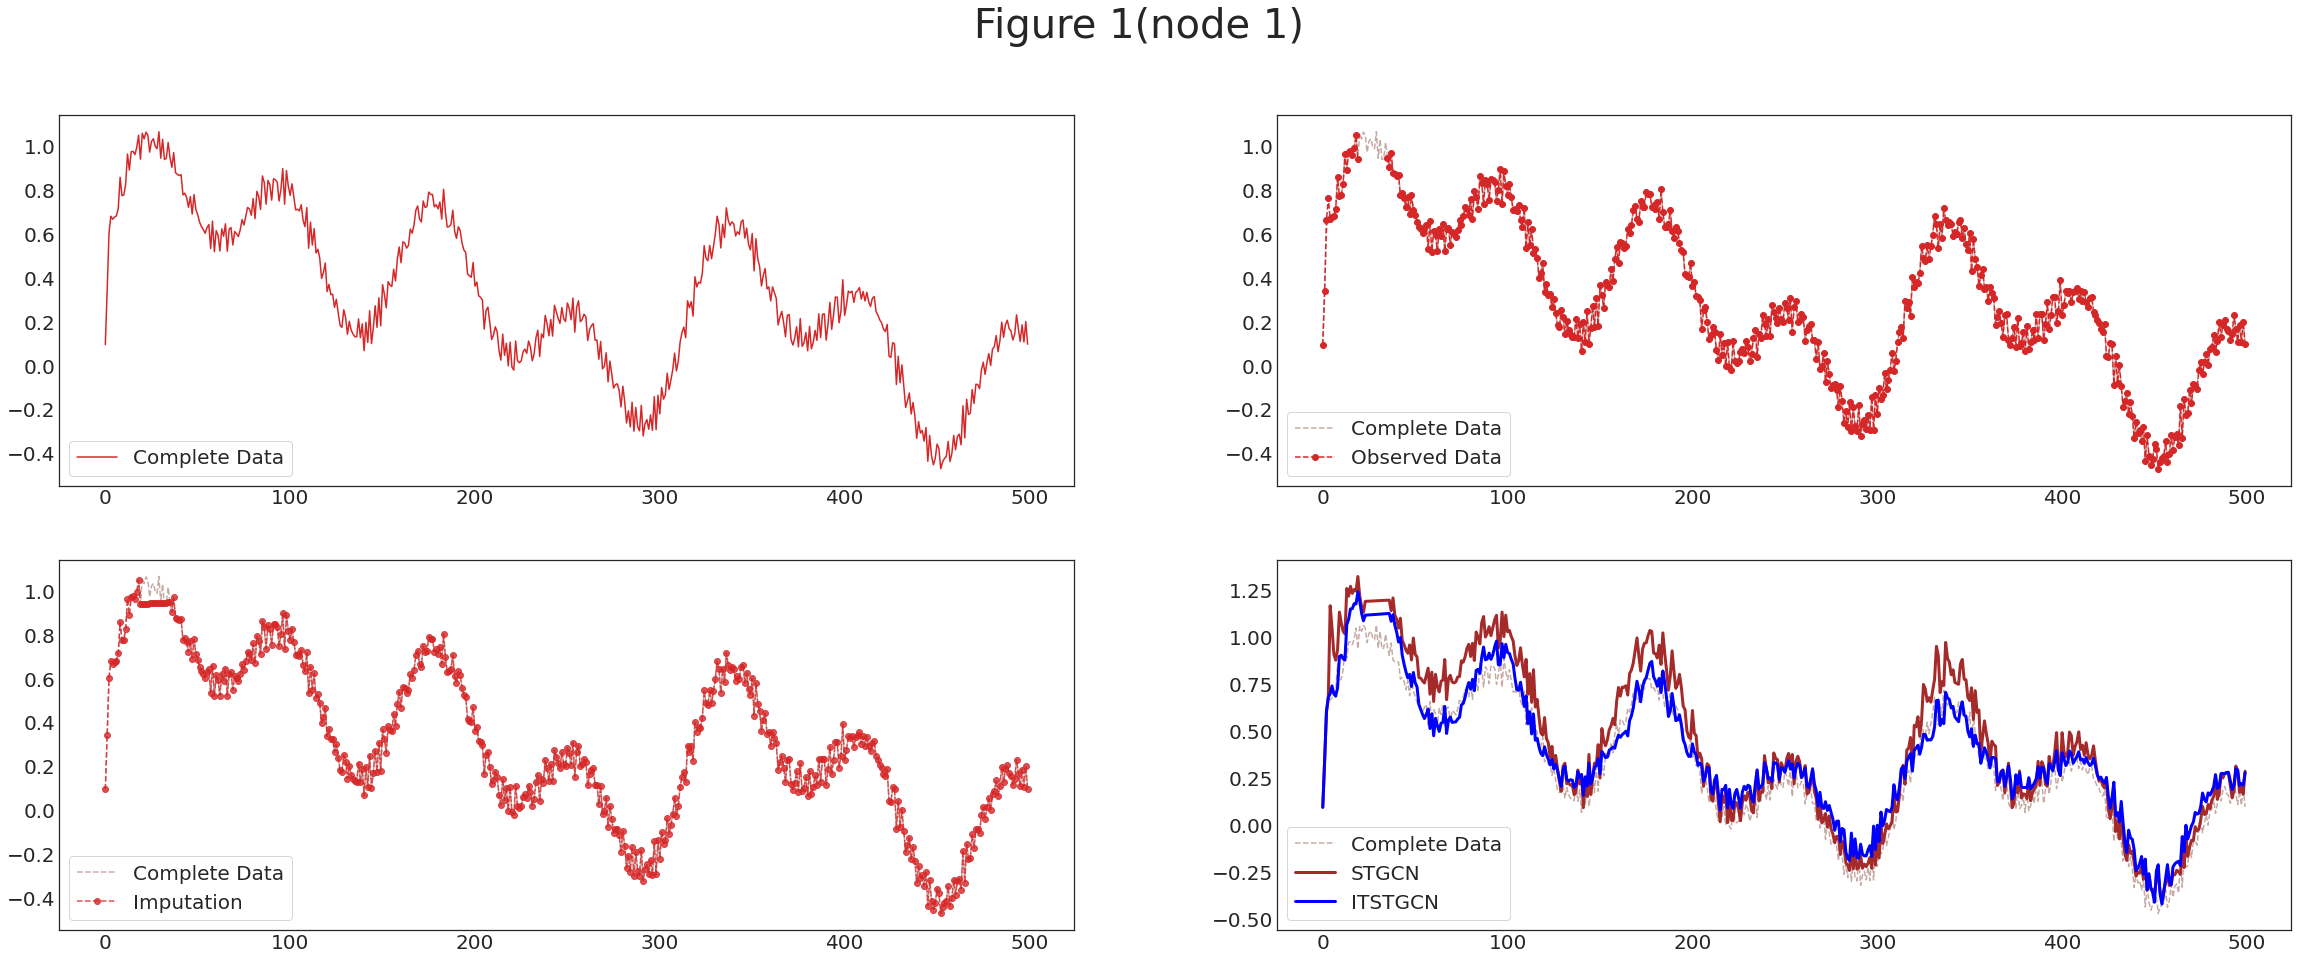
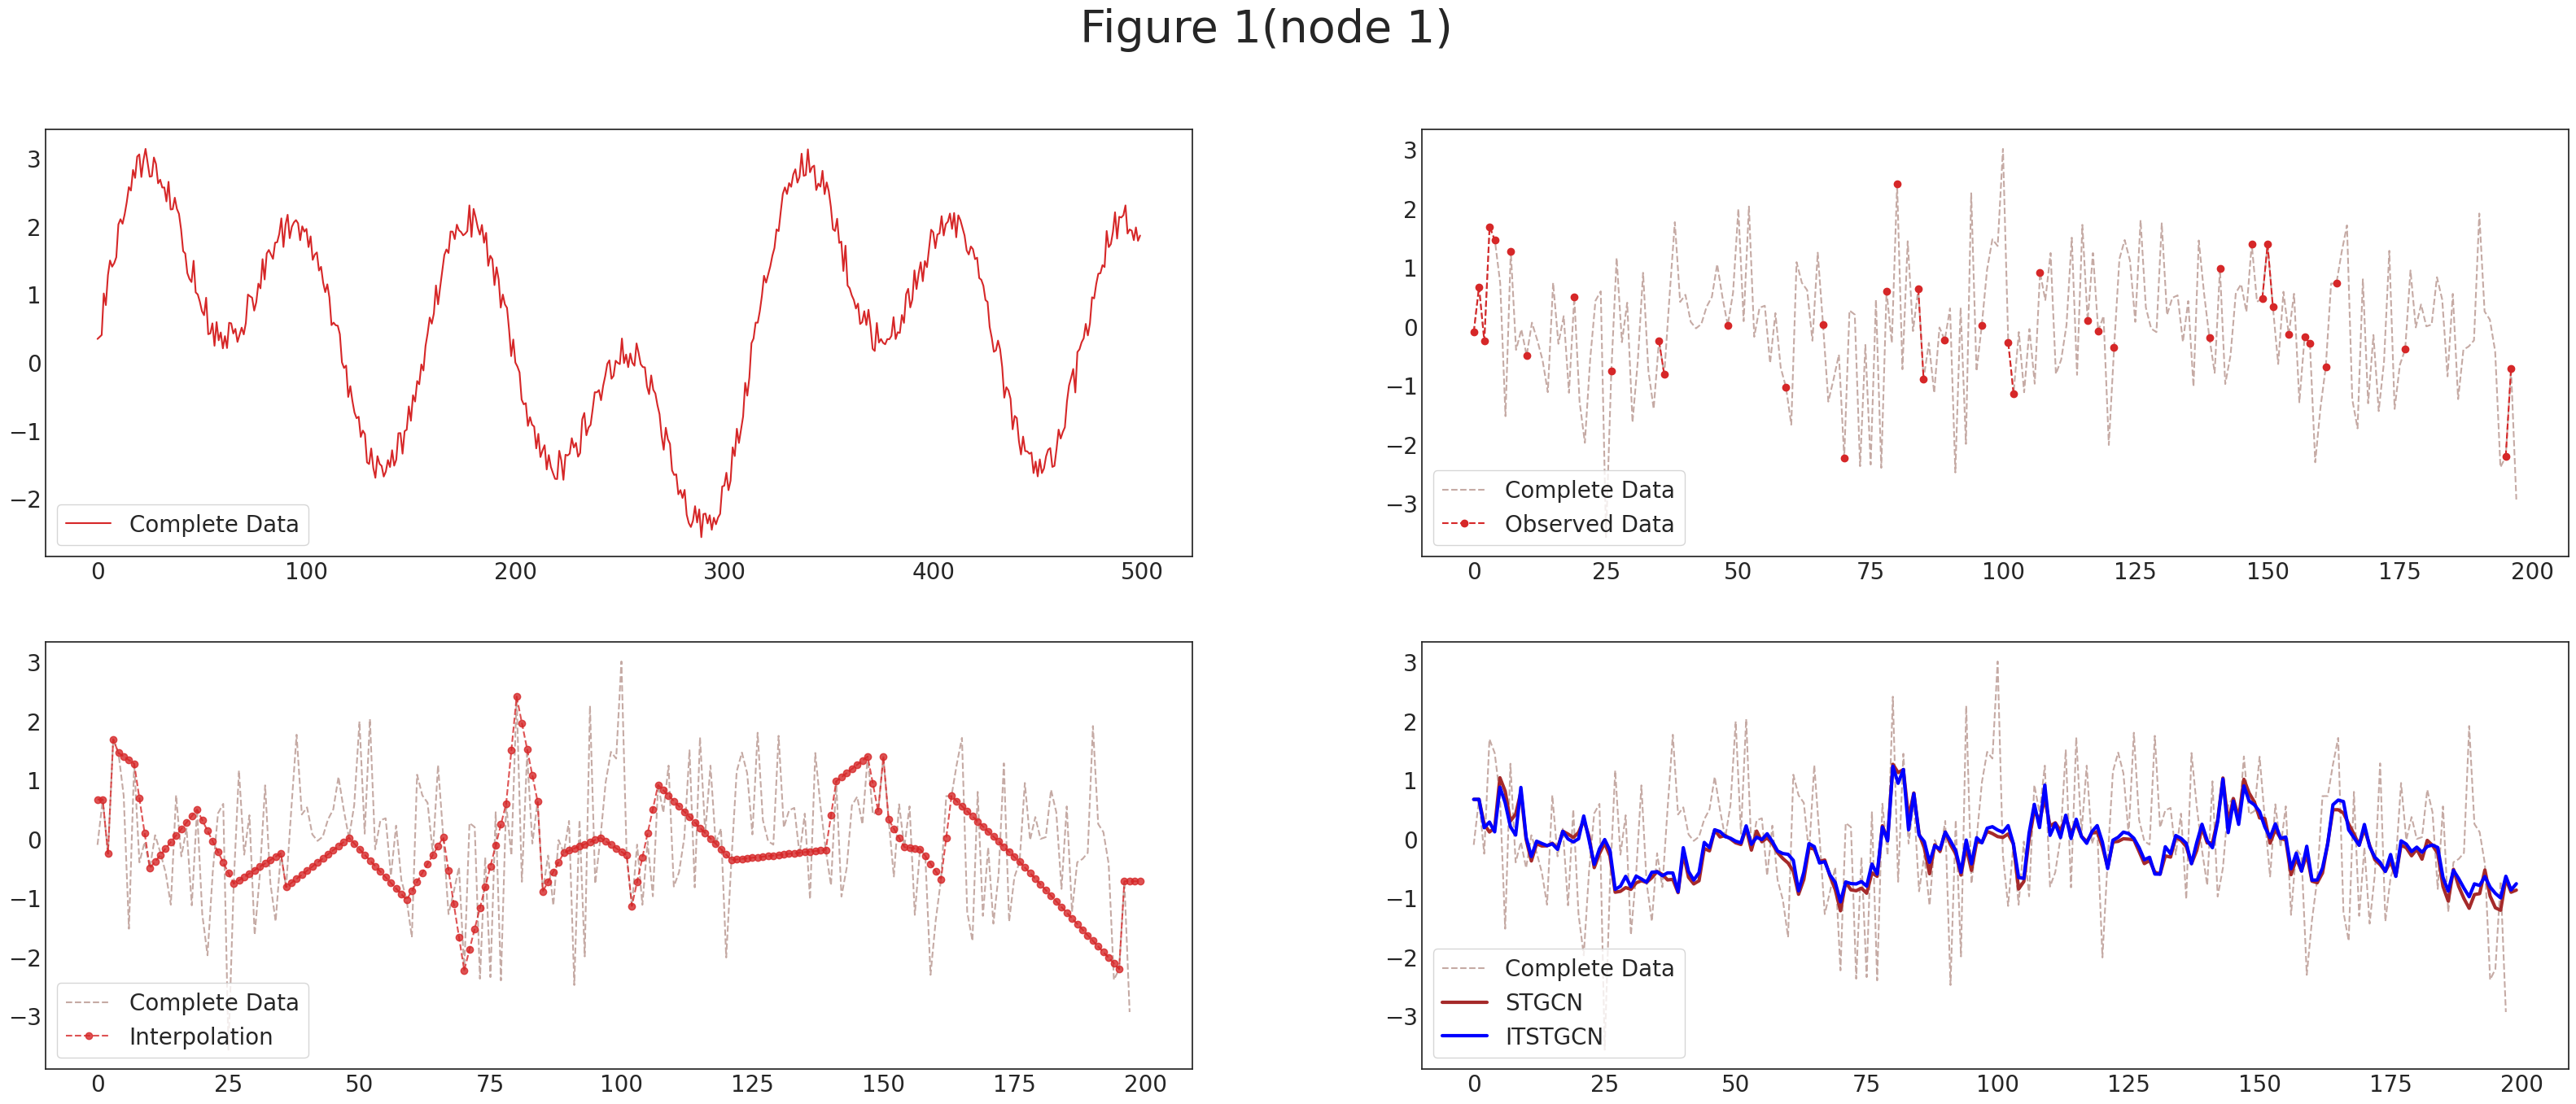
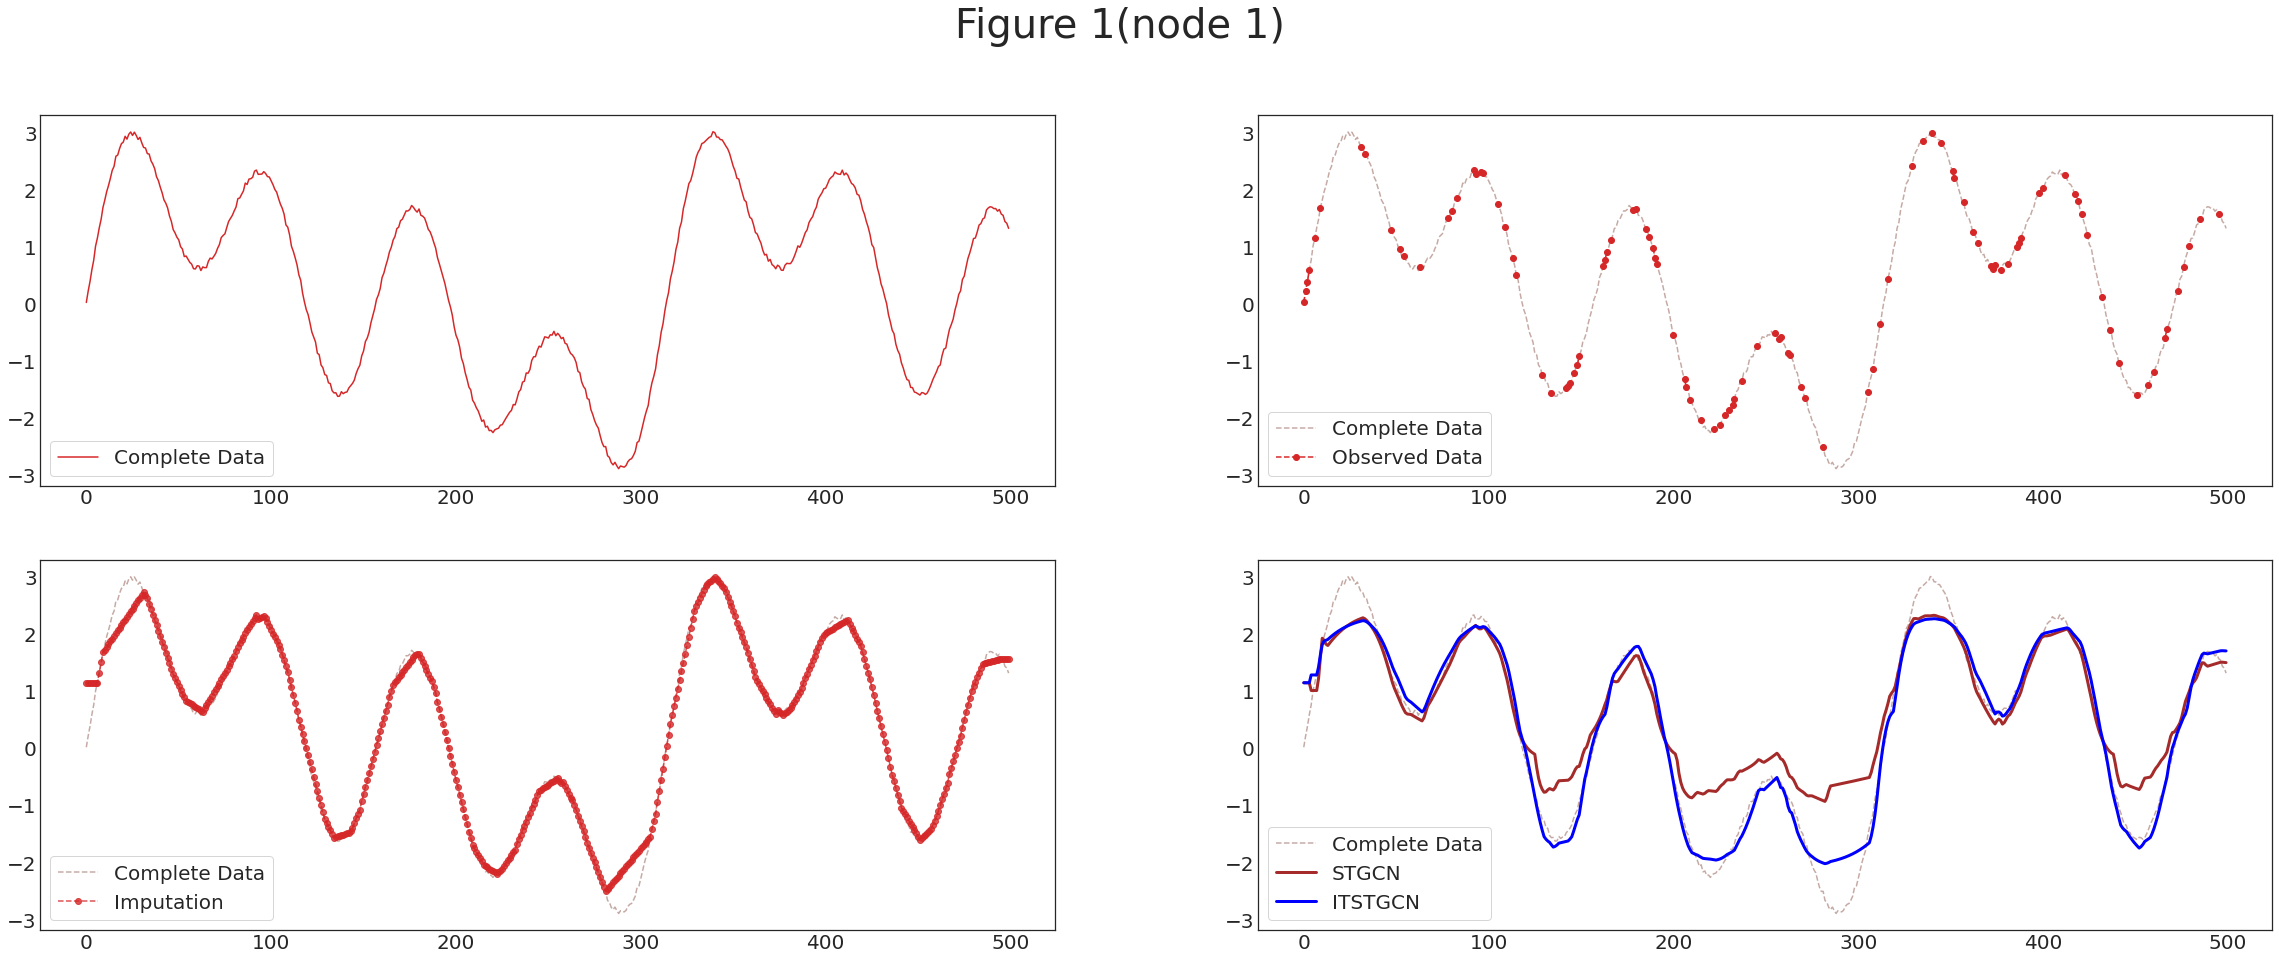
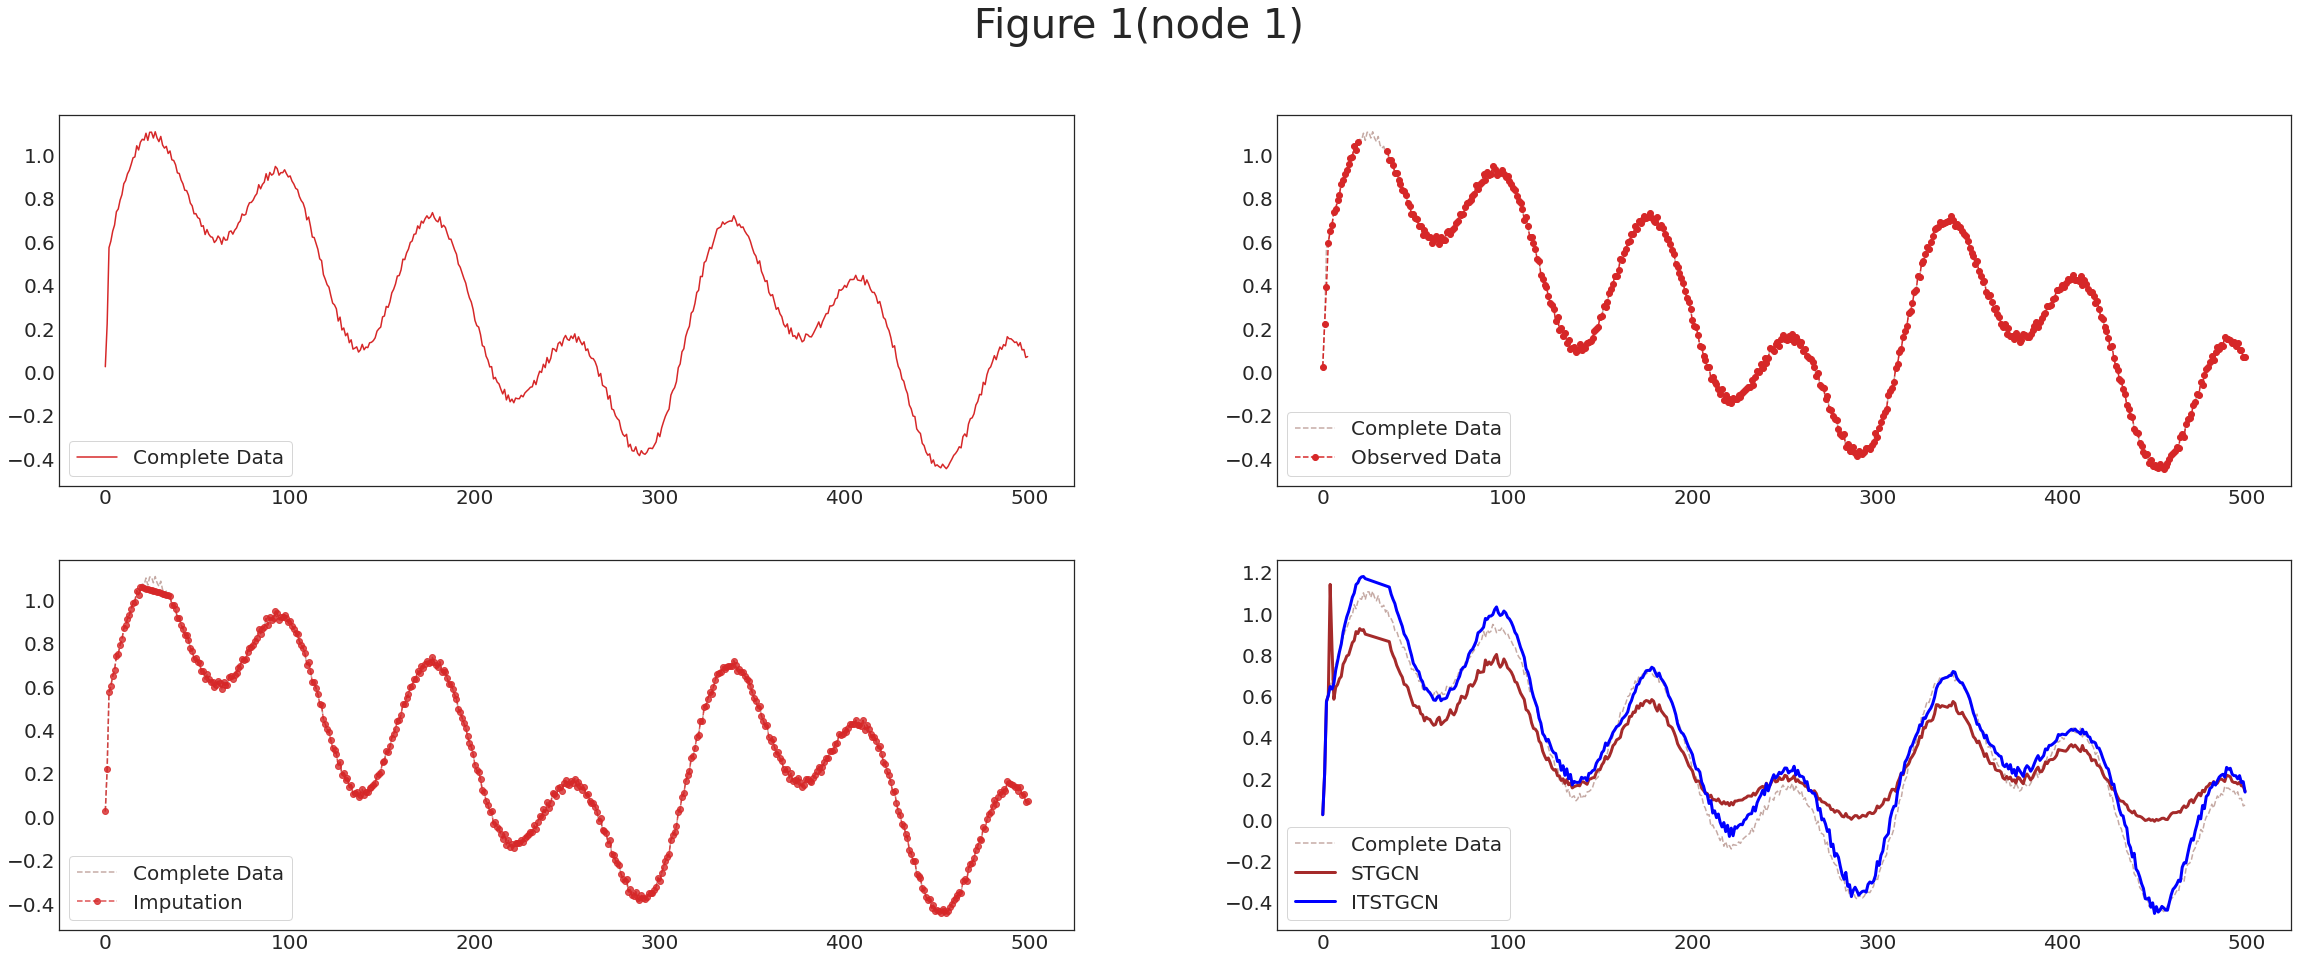
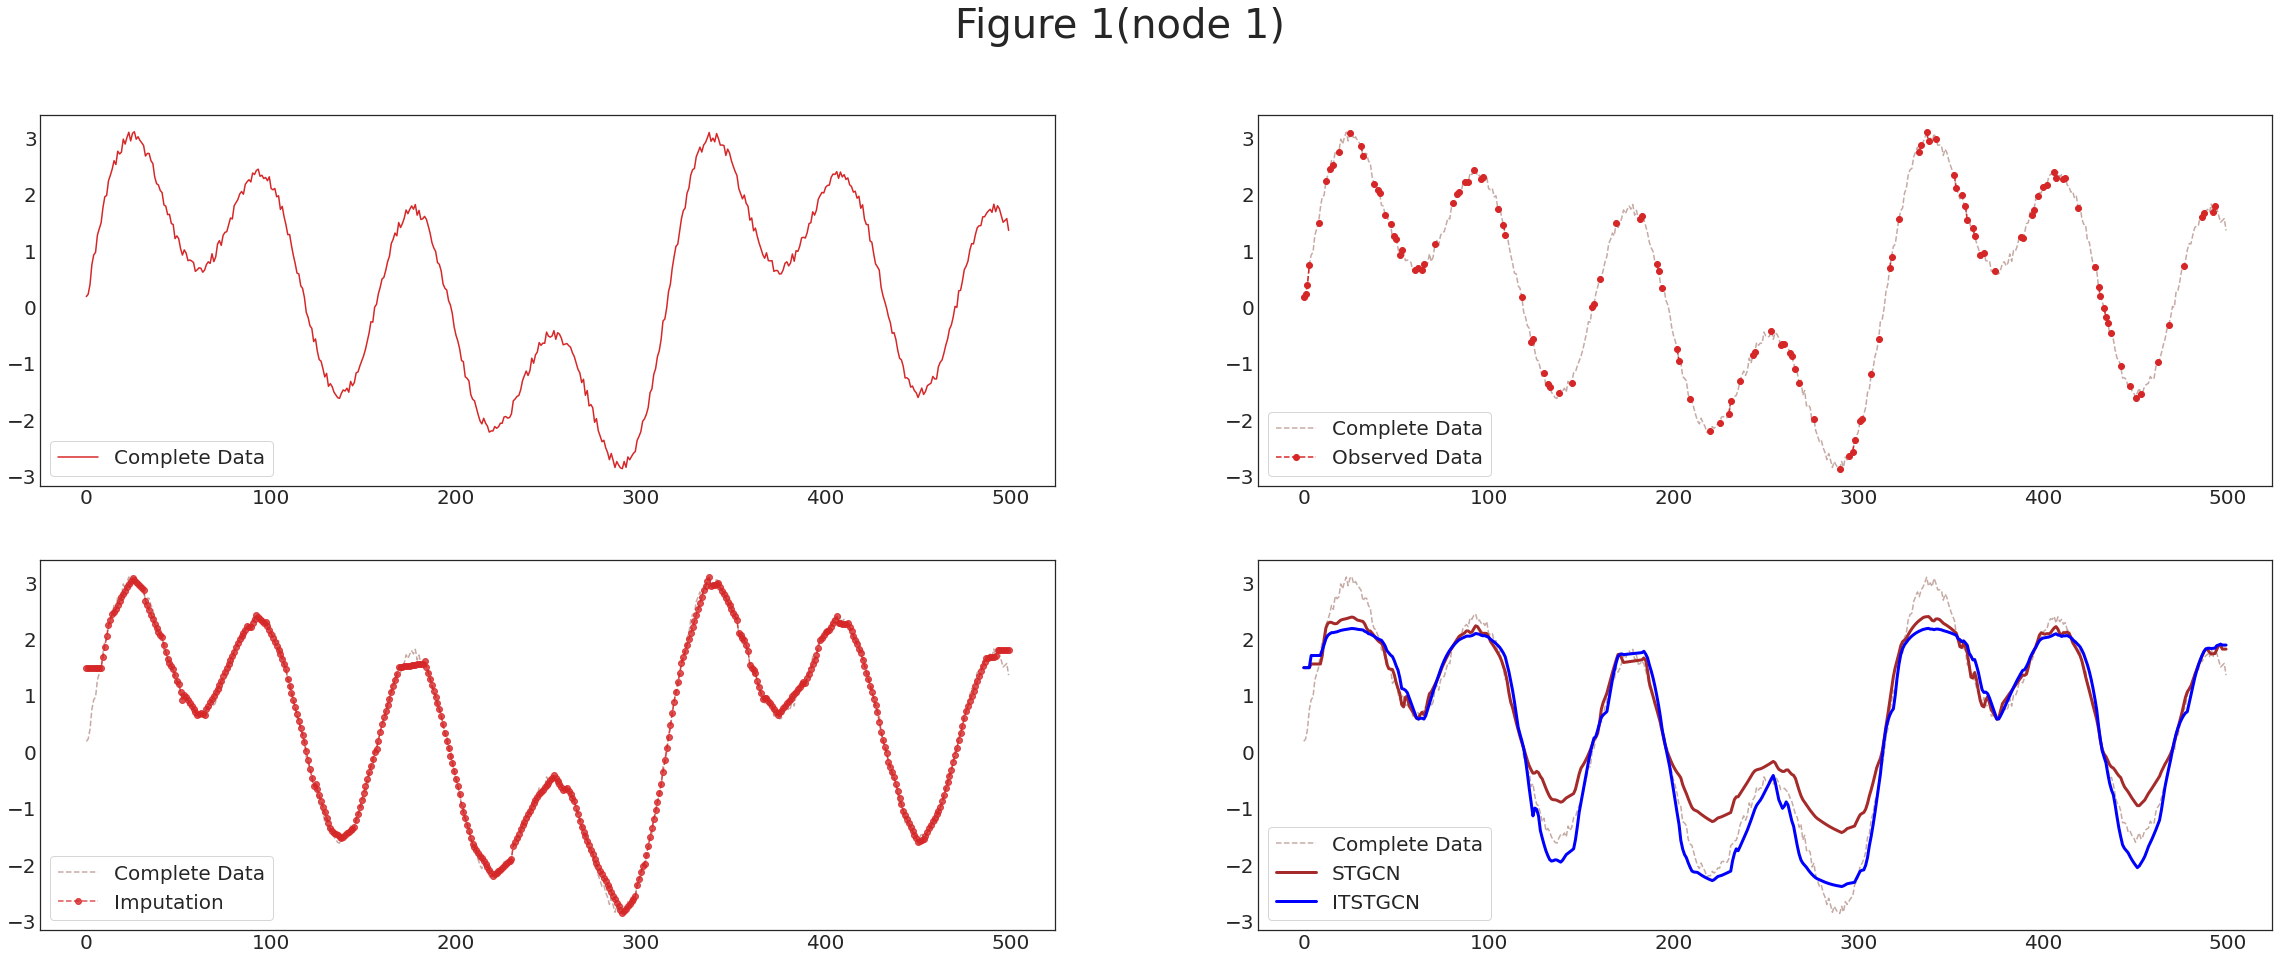
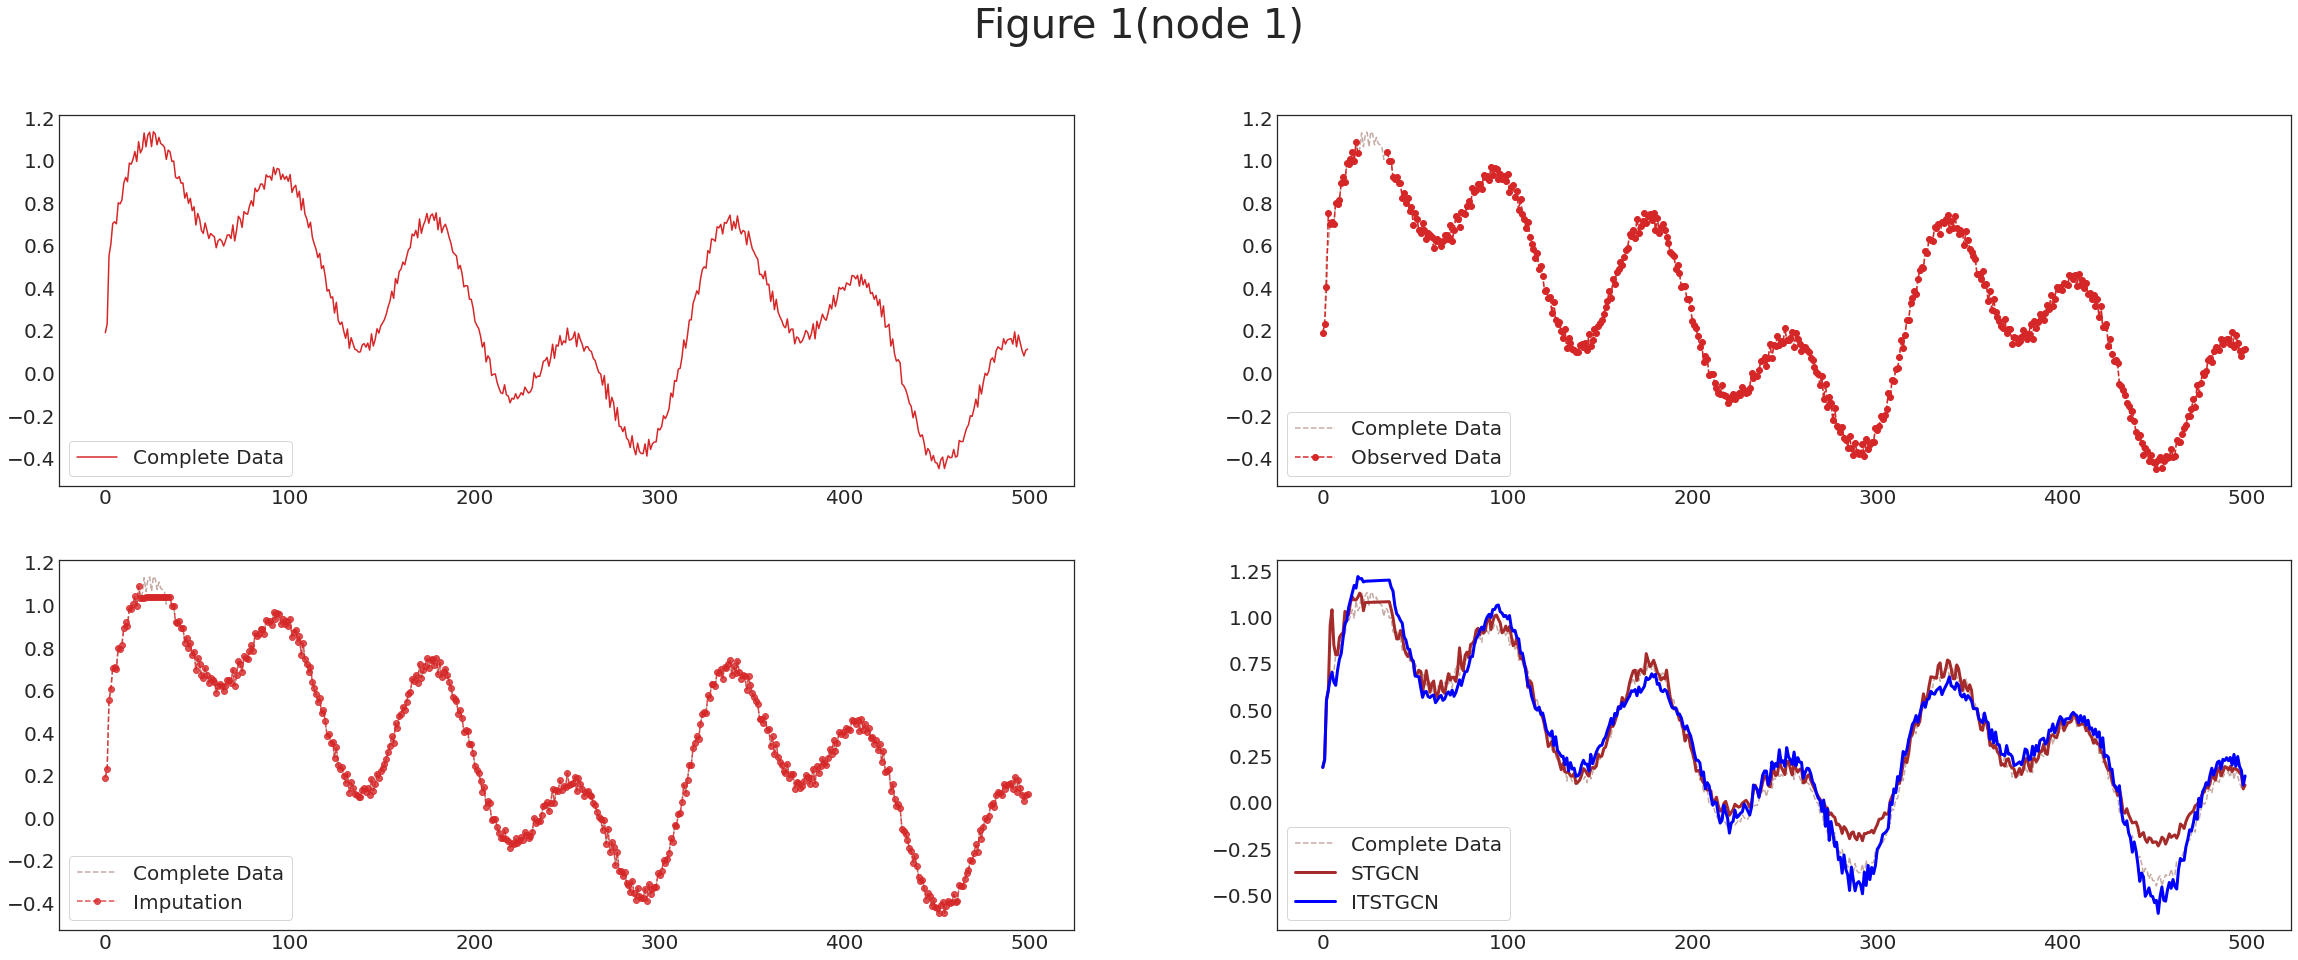
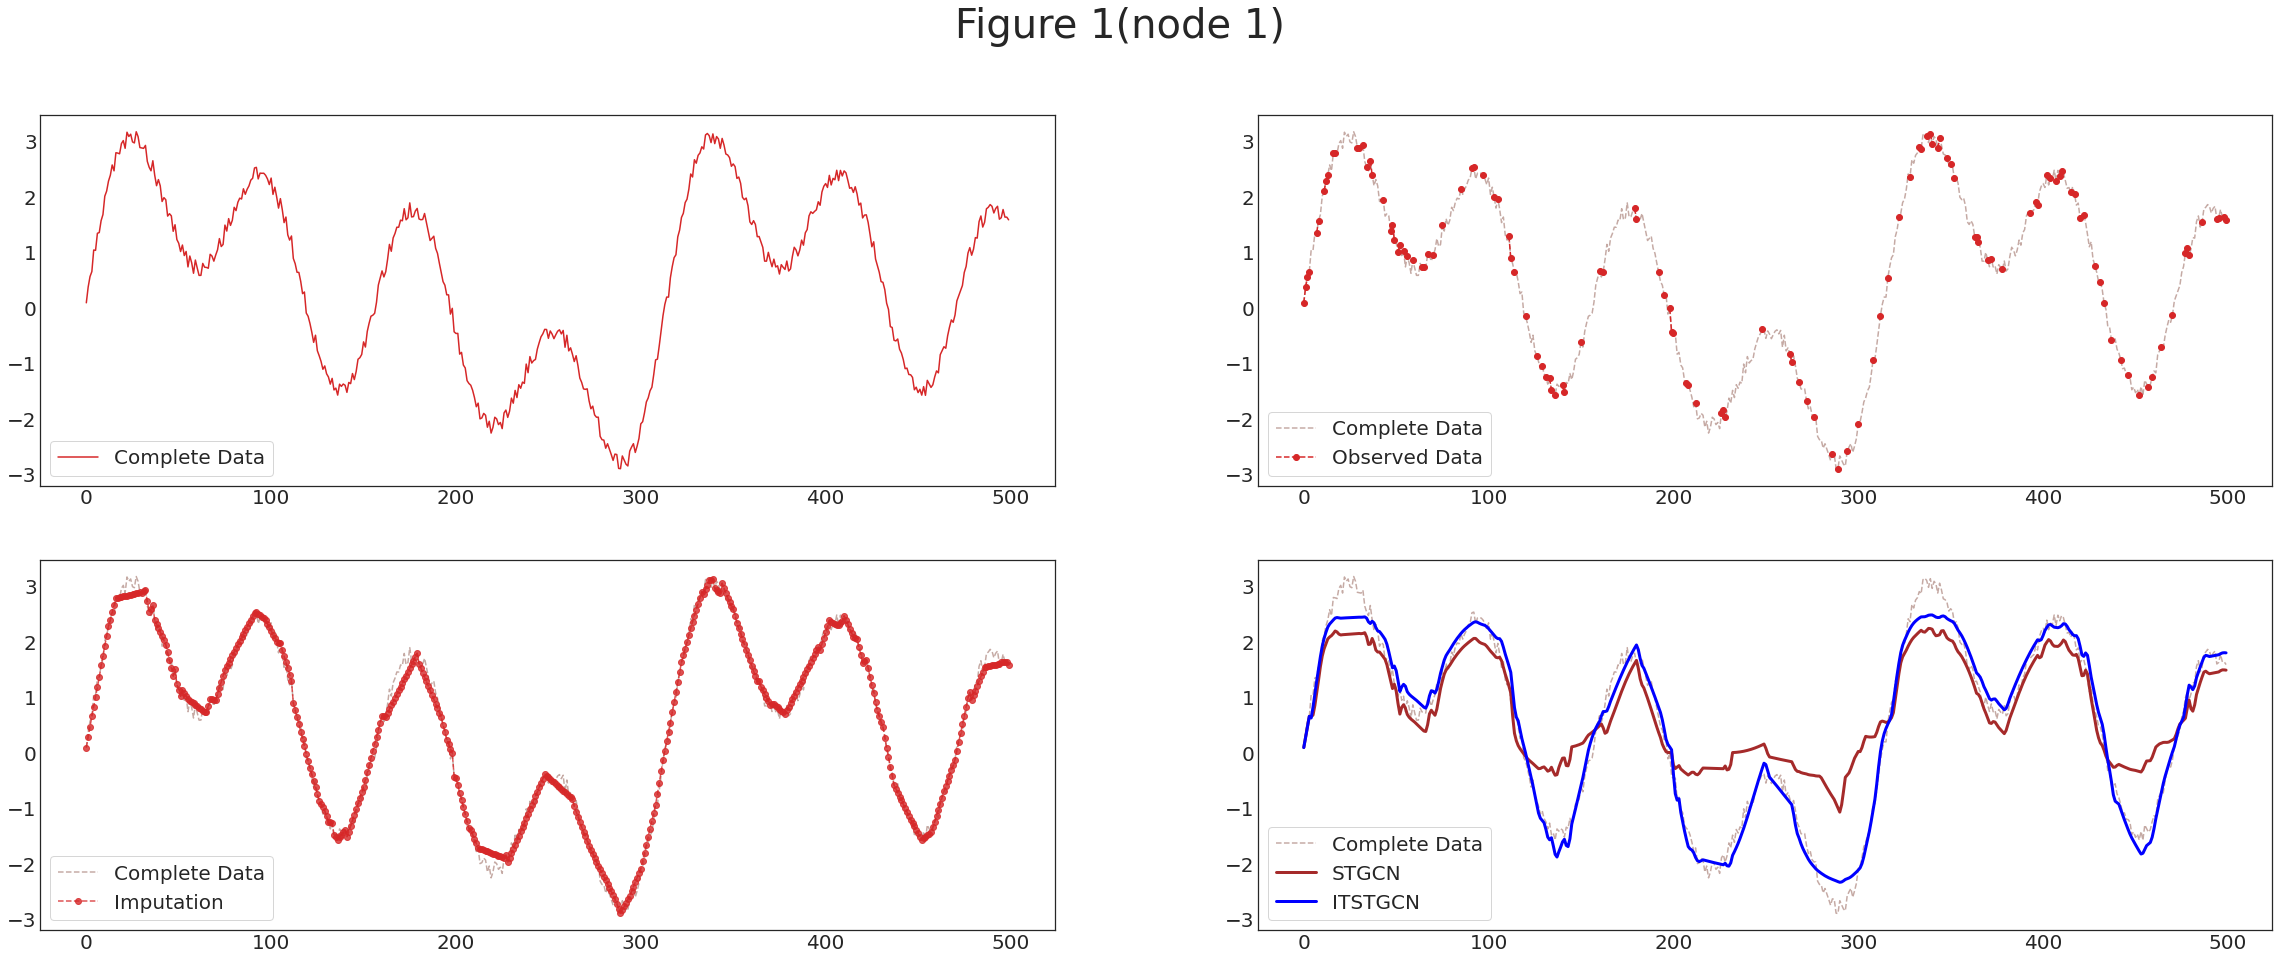
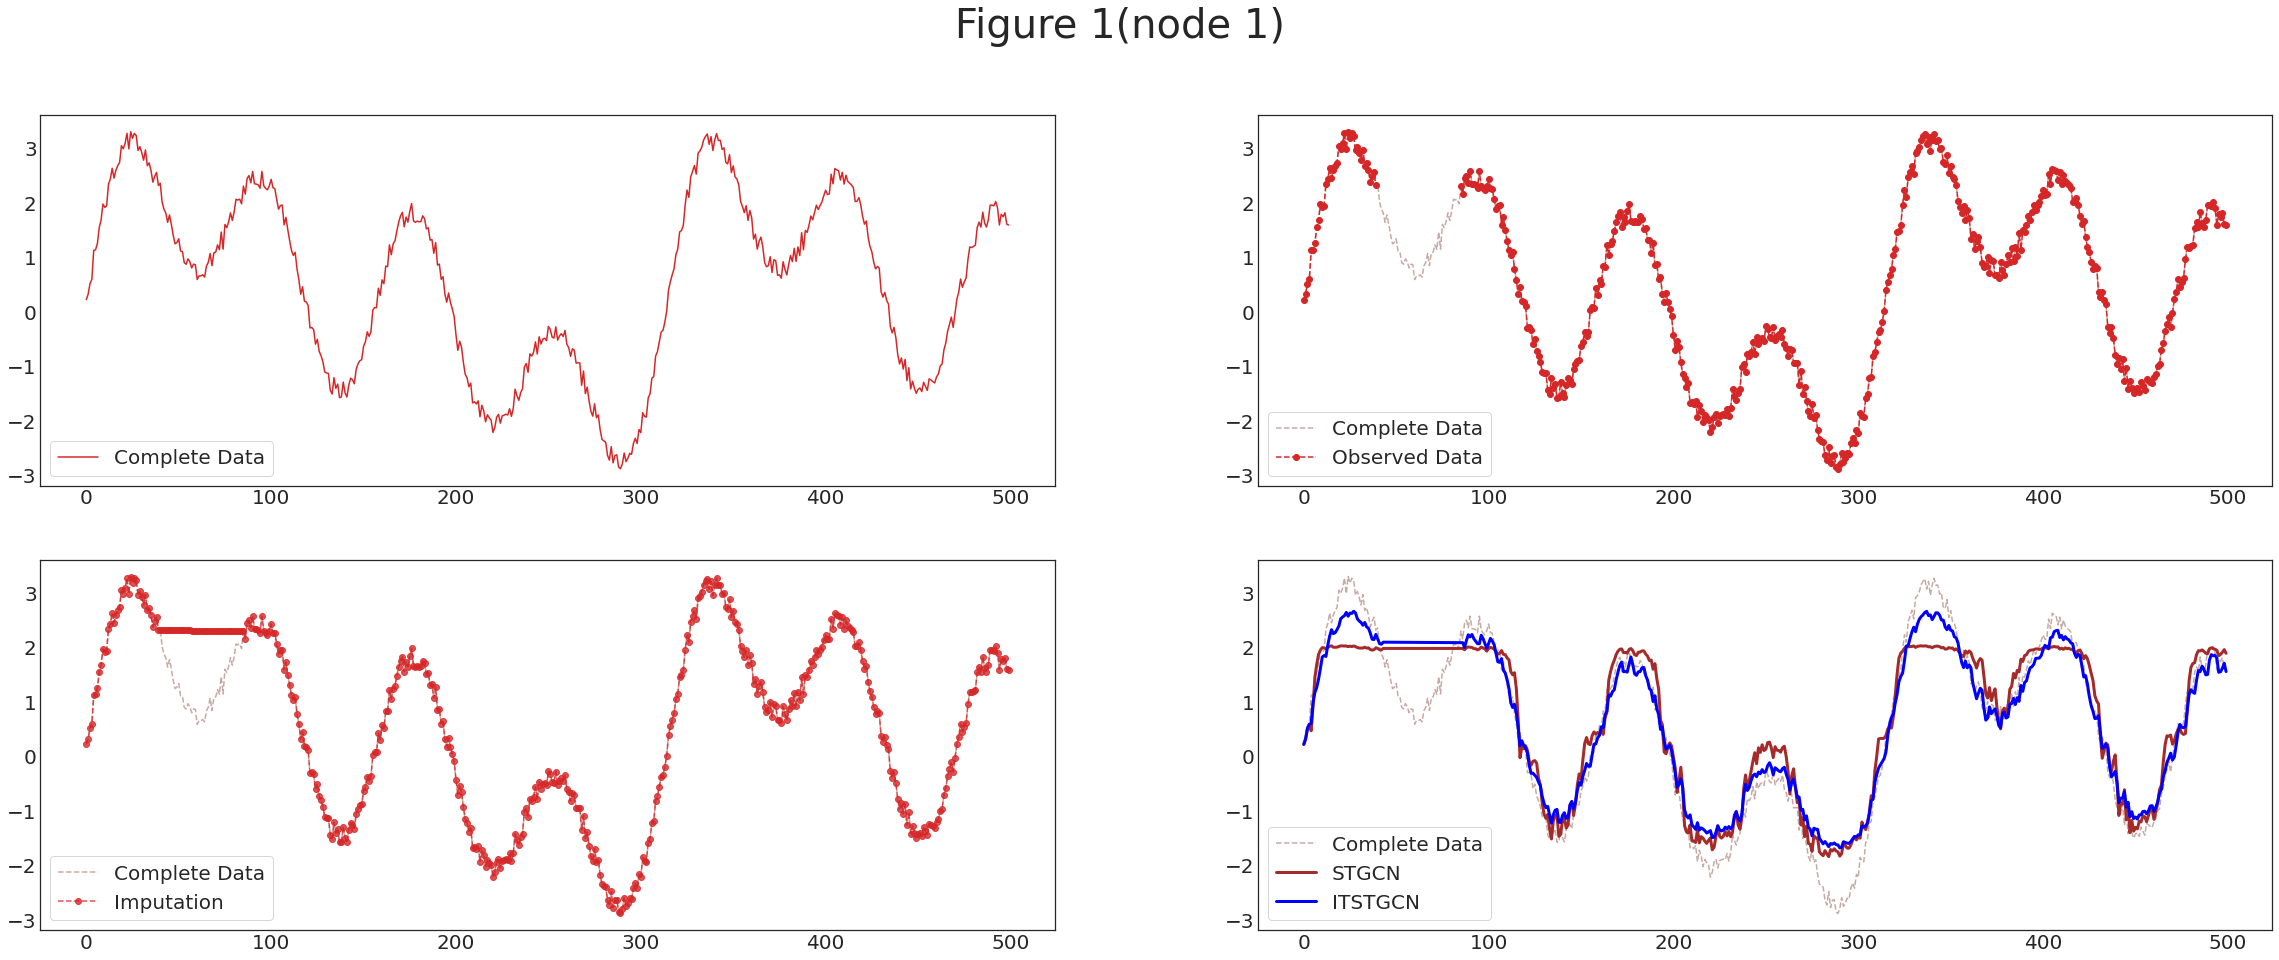
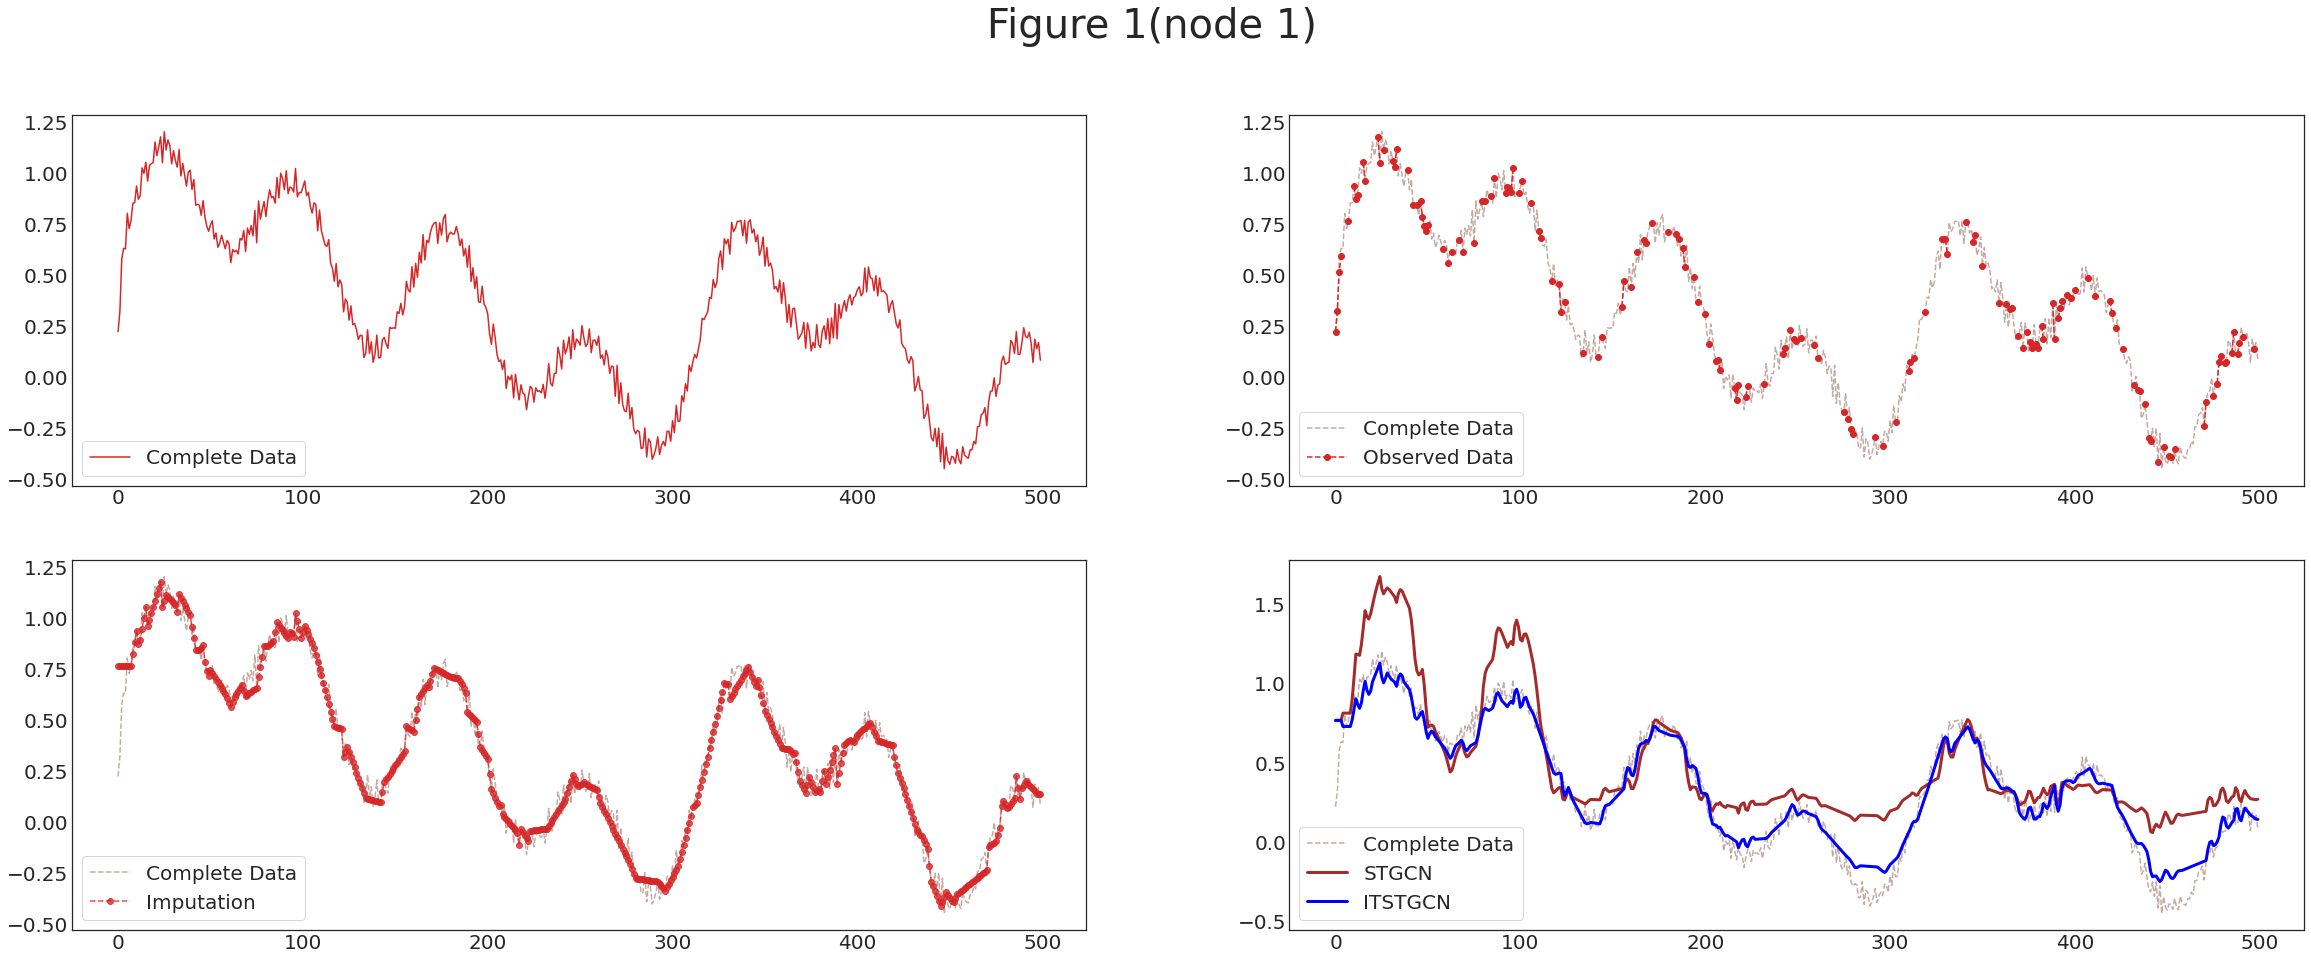
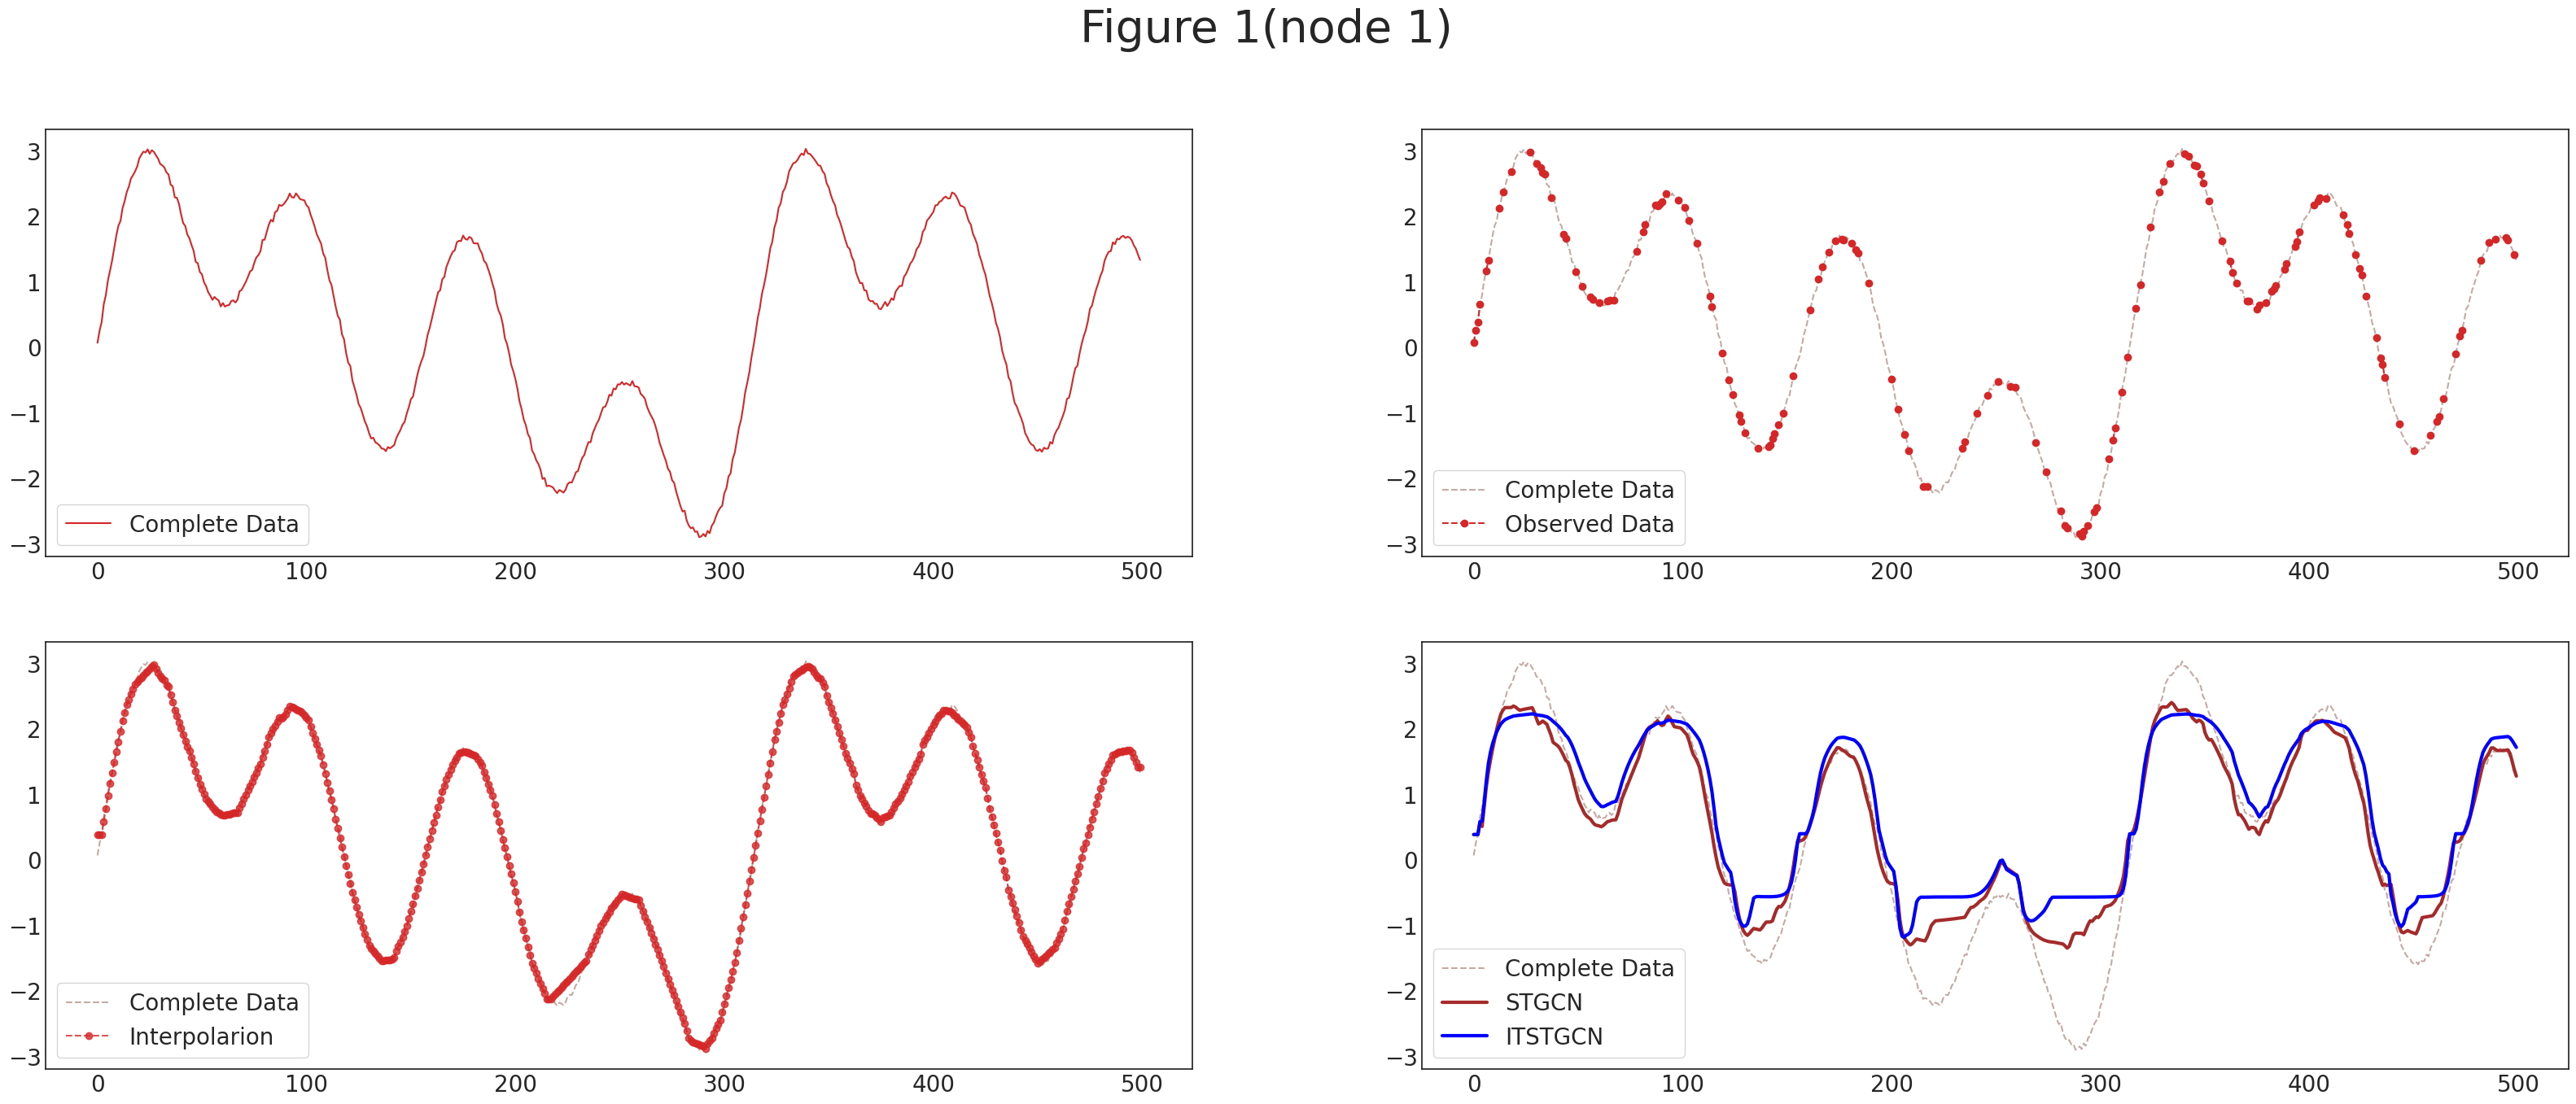
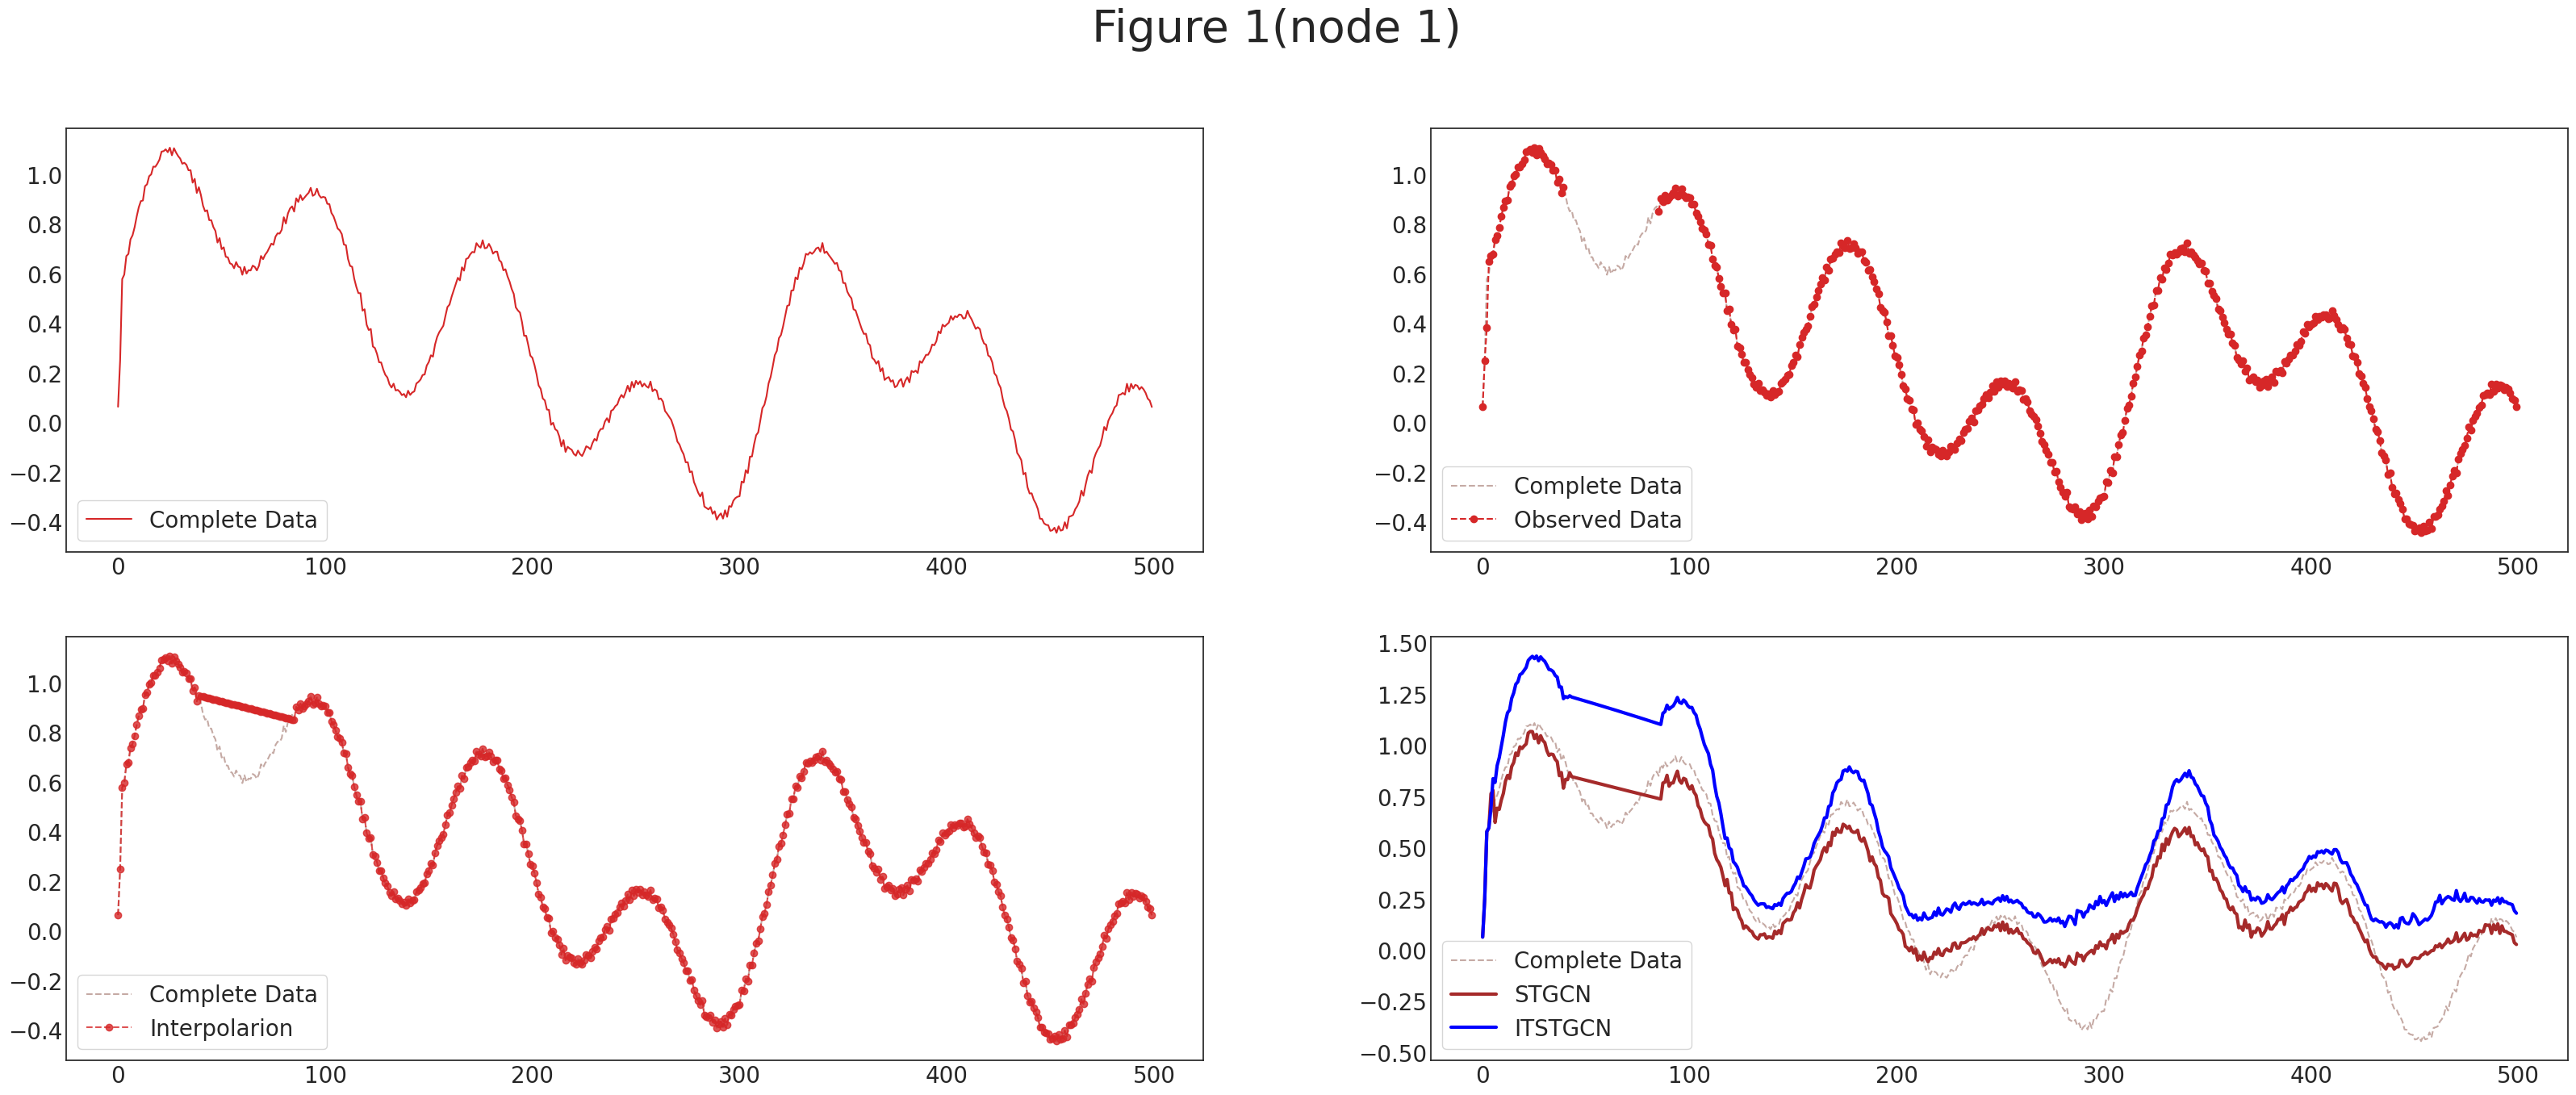
fig, ((ax1, ax2), (ax3, ax4)) = plt.subplots(2, 2,figsize=(40,15))
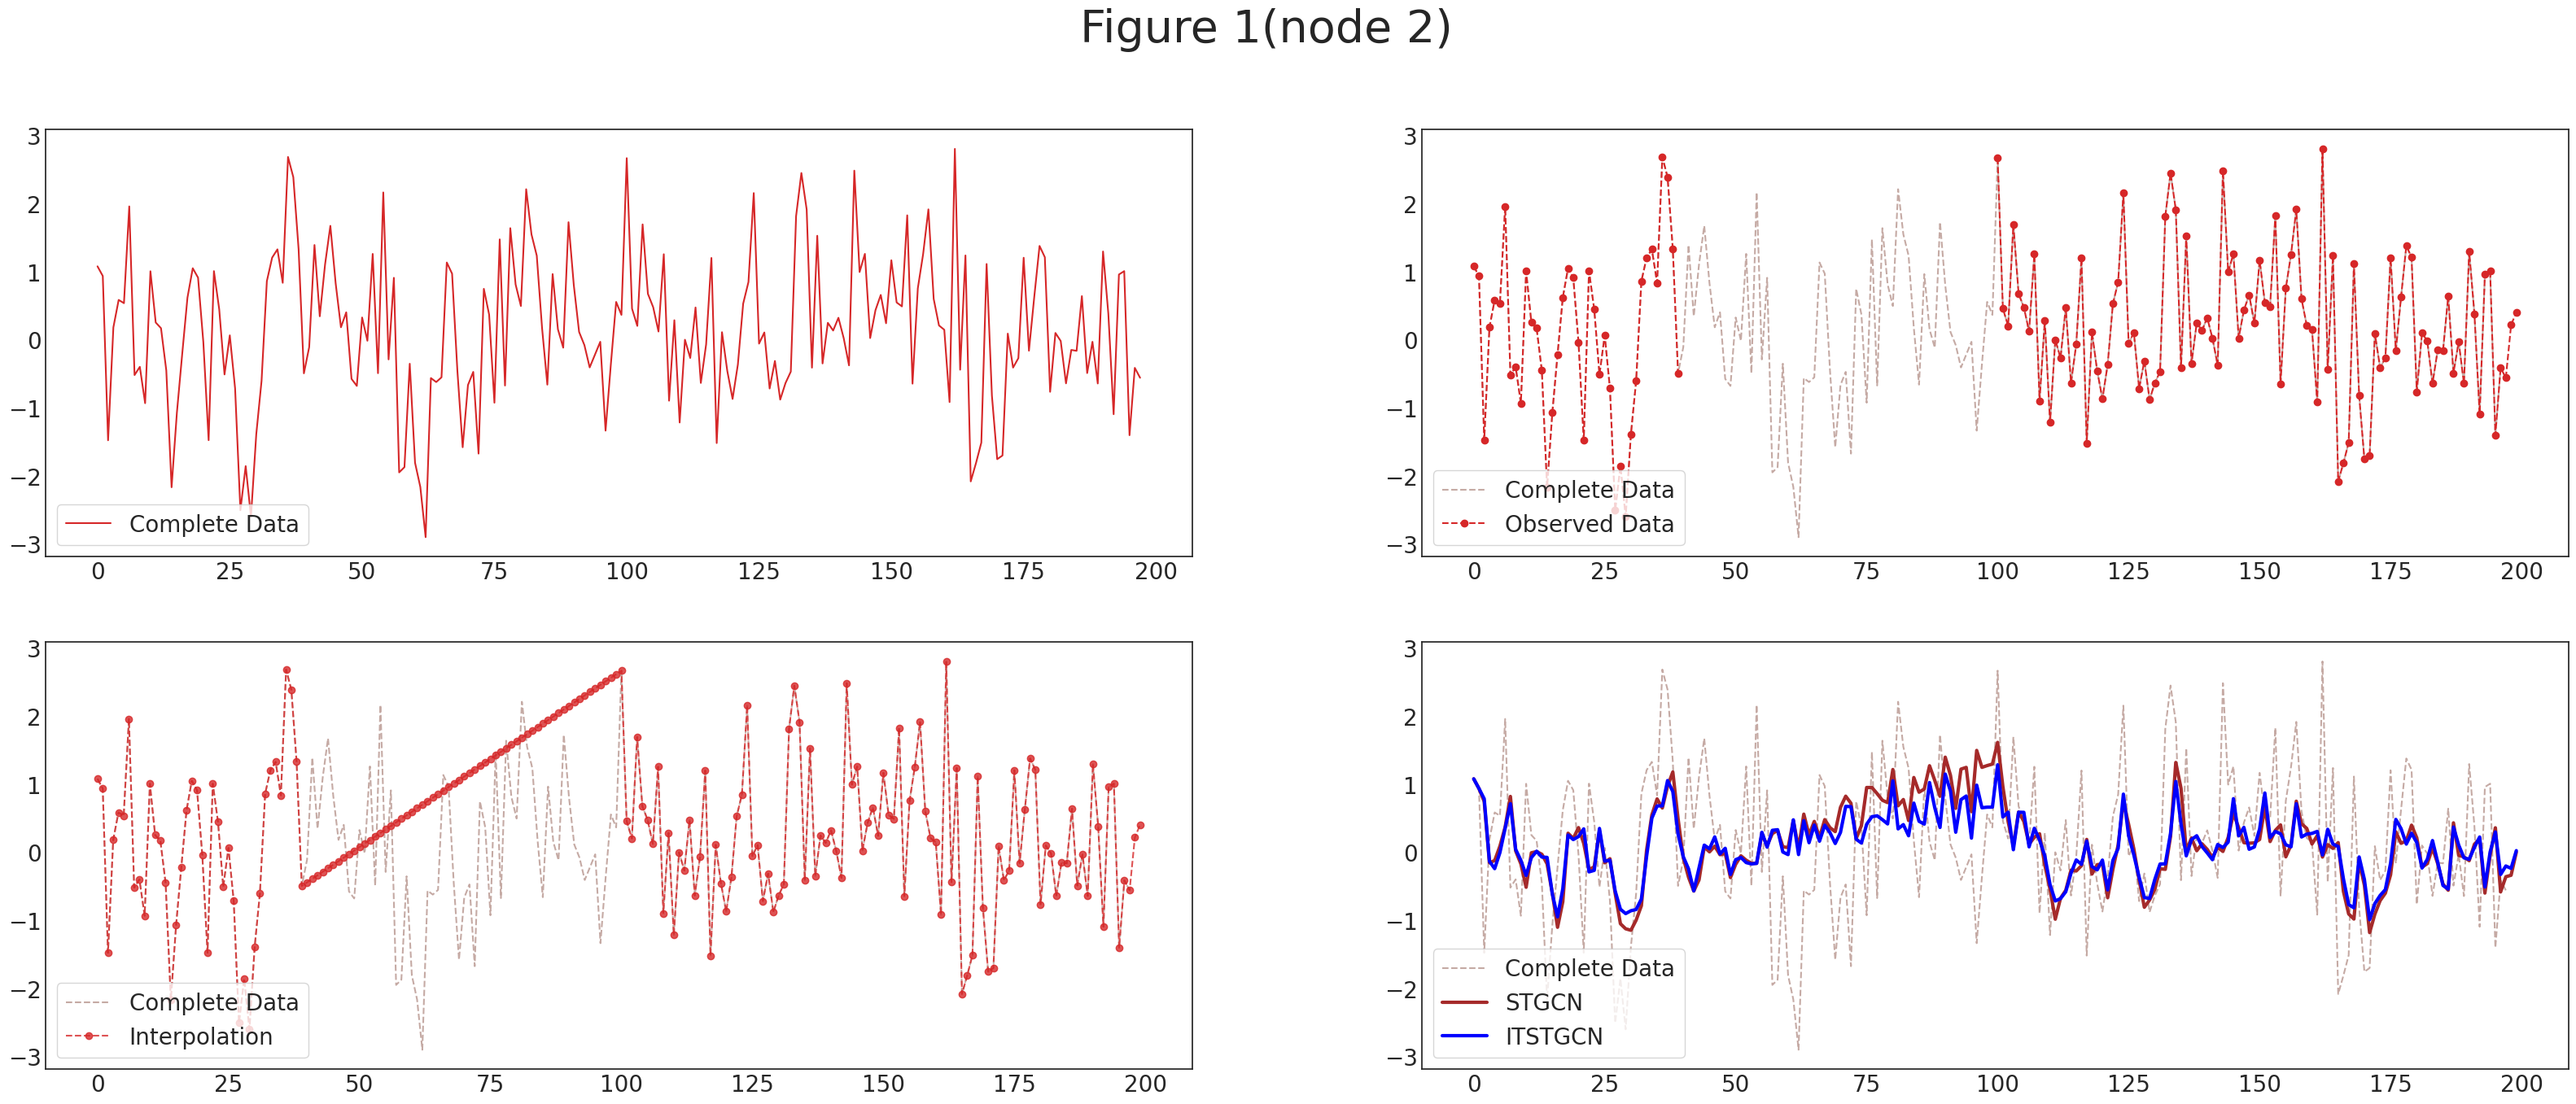
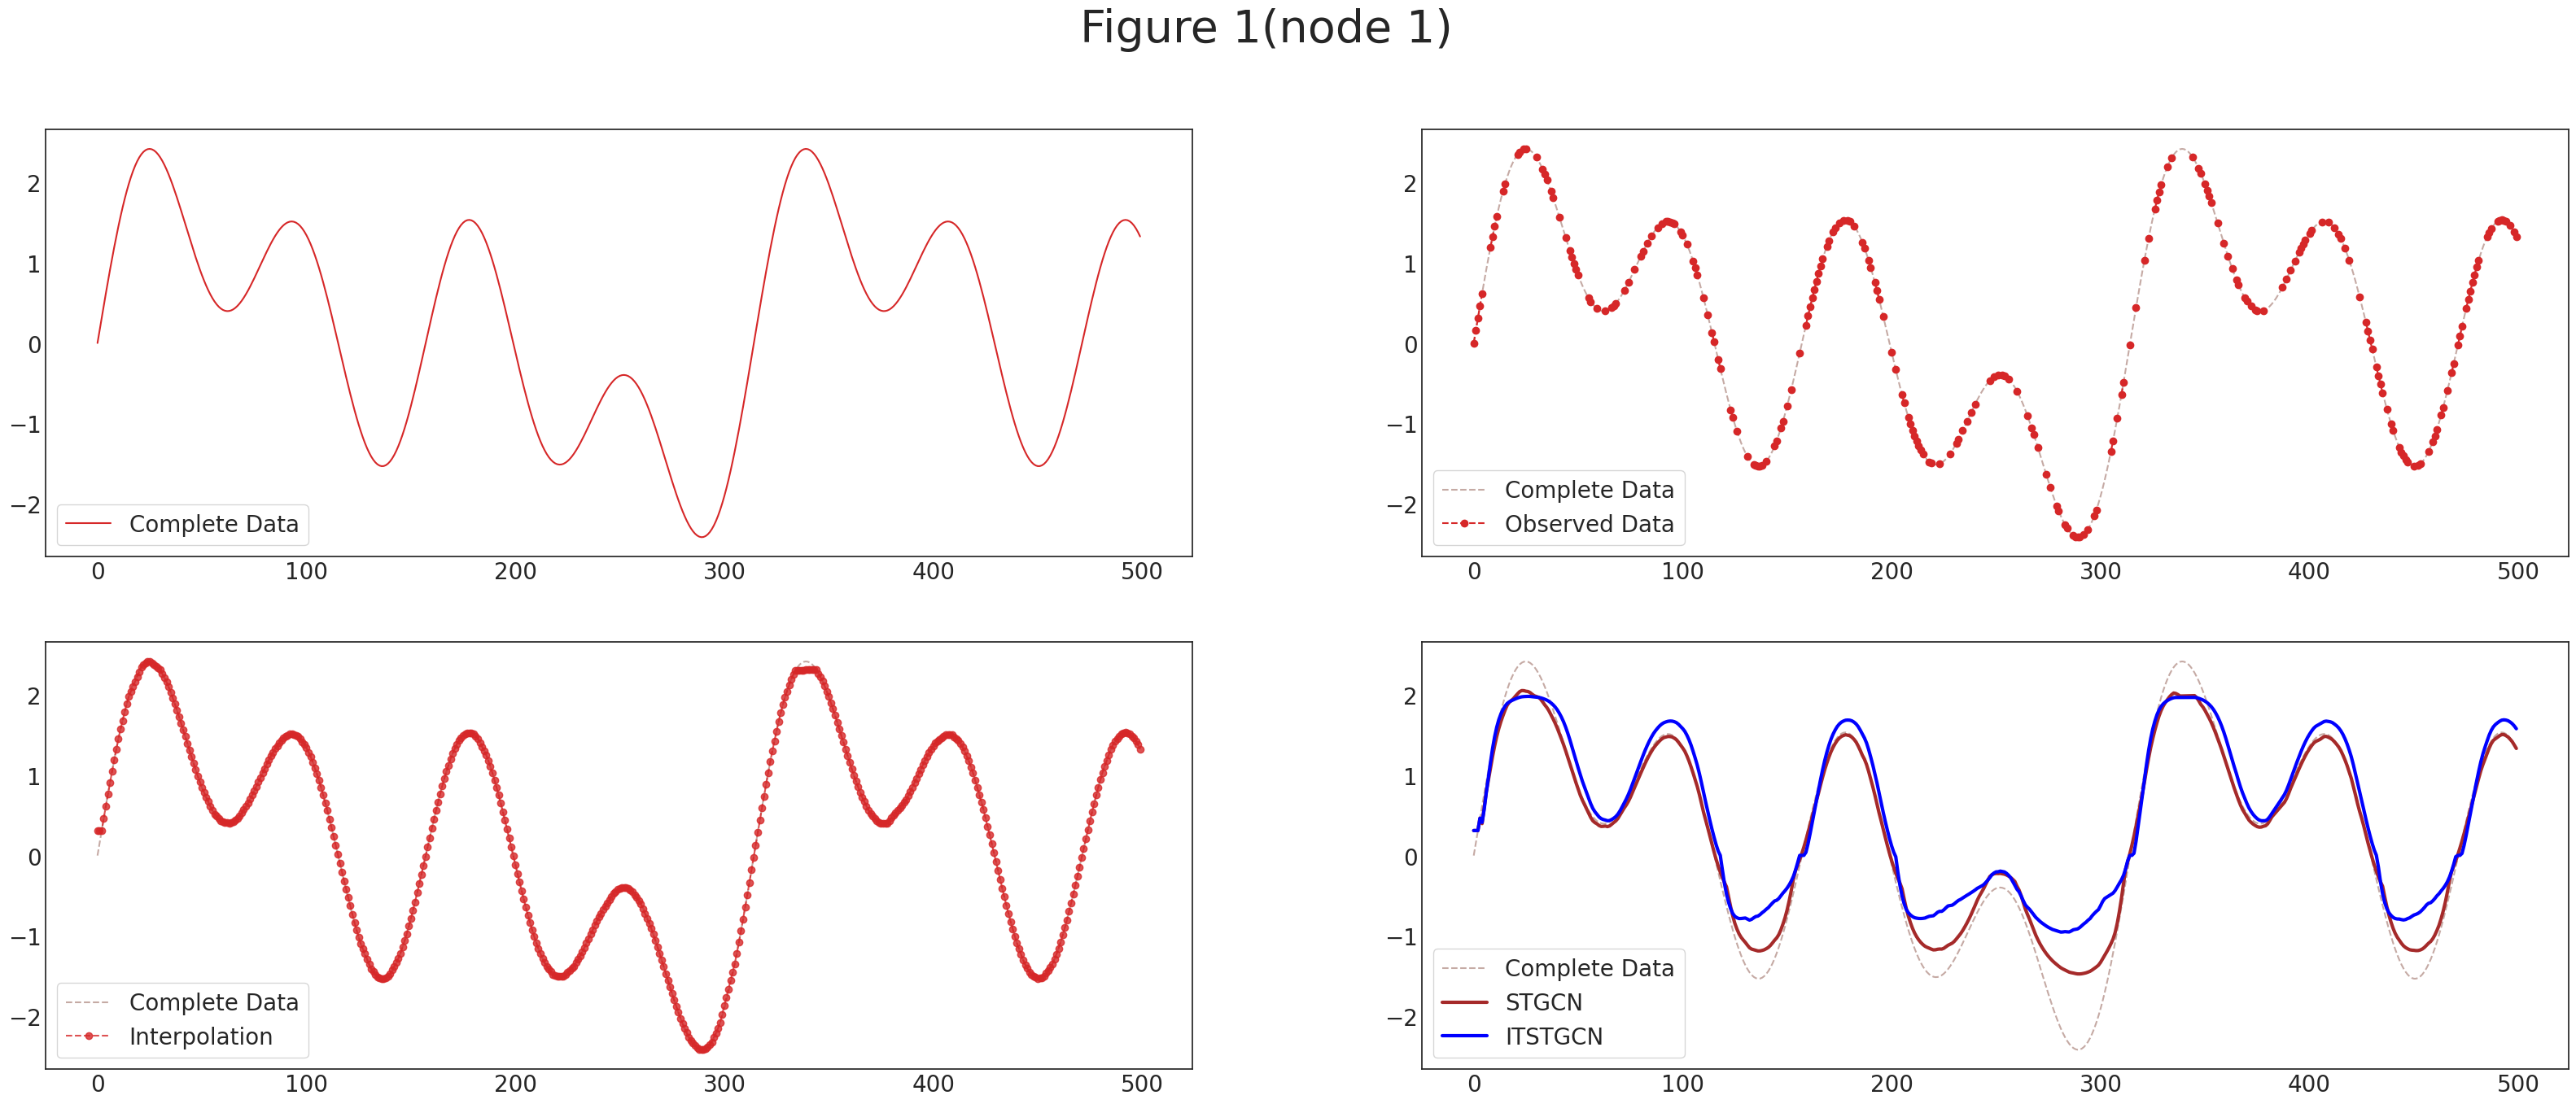
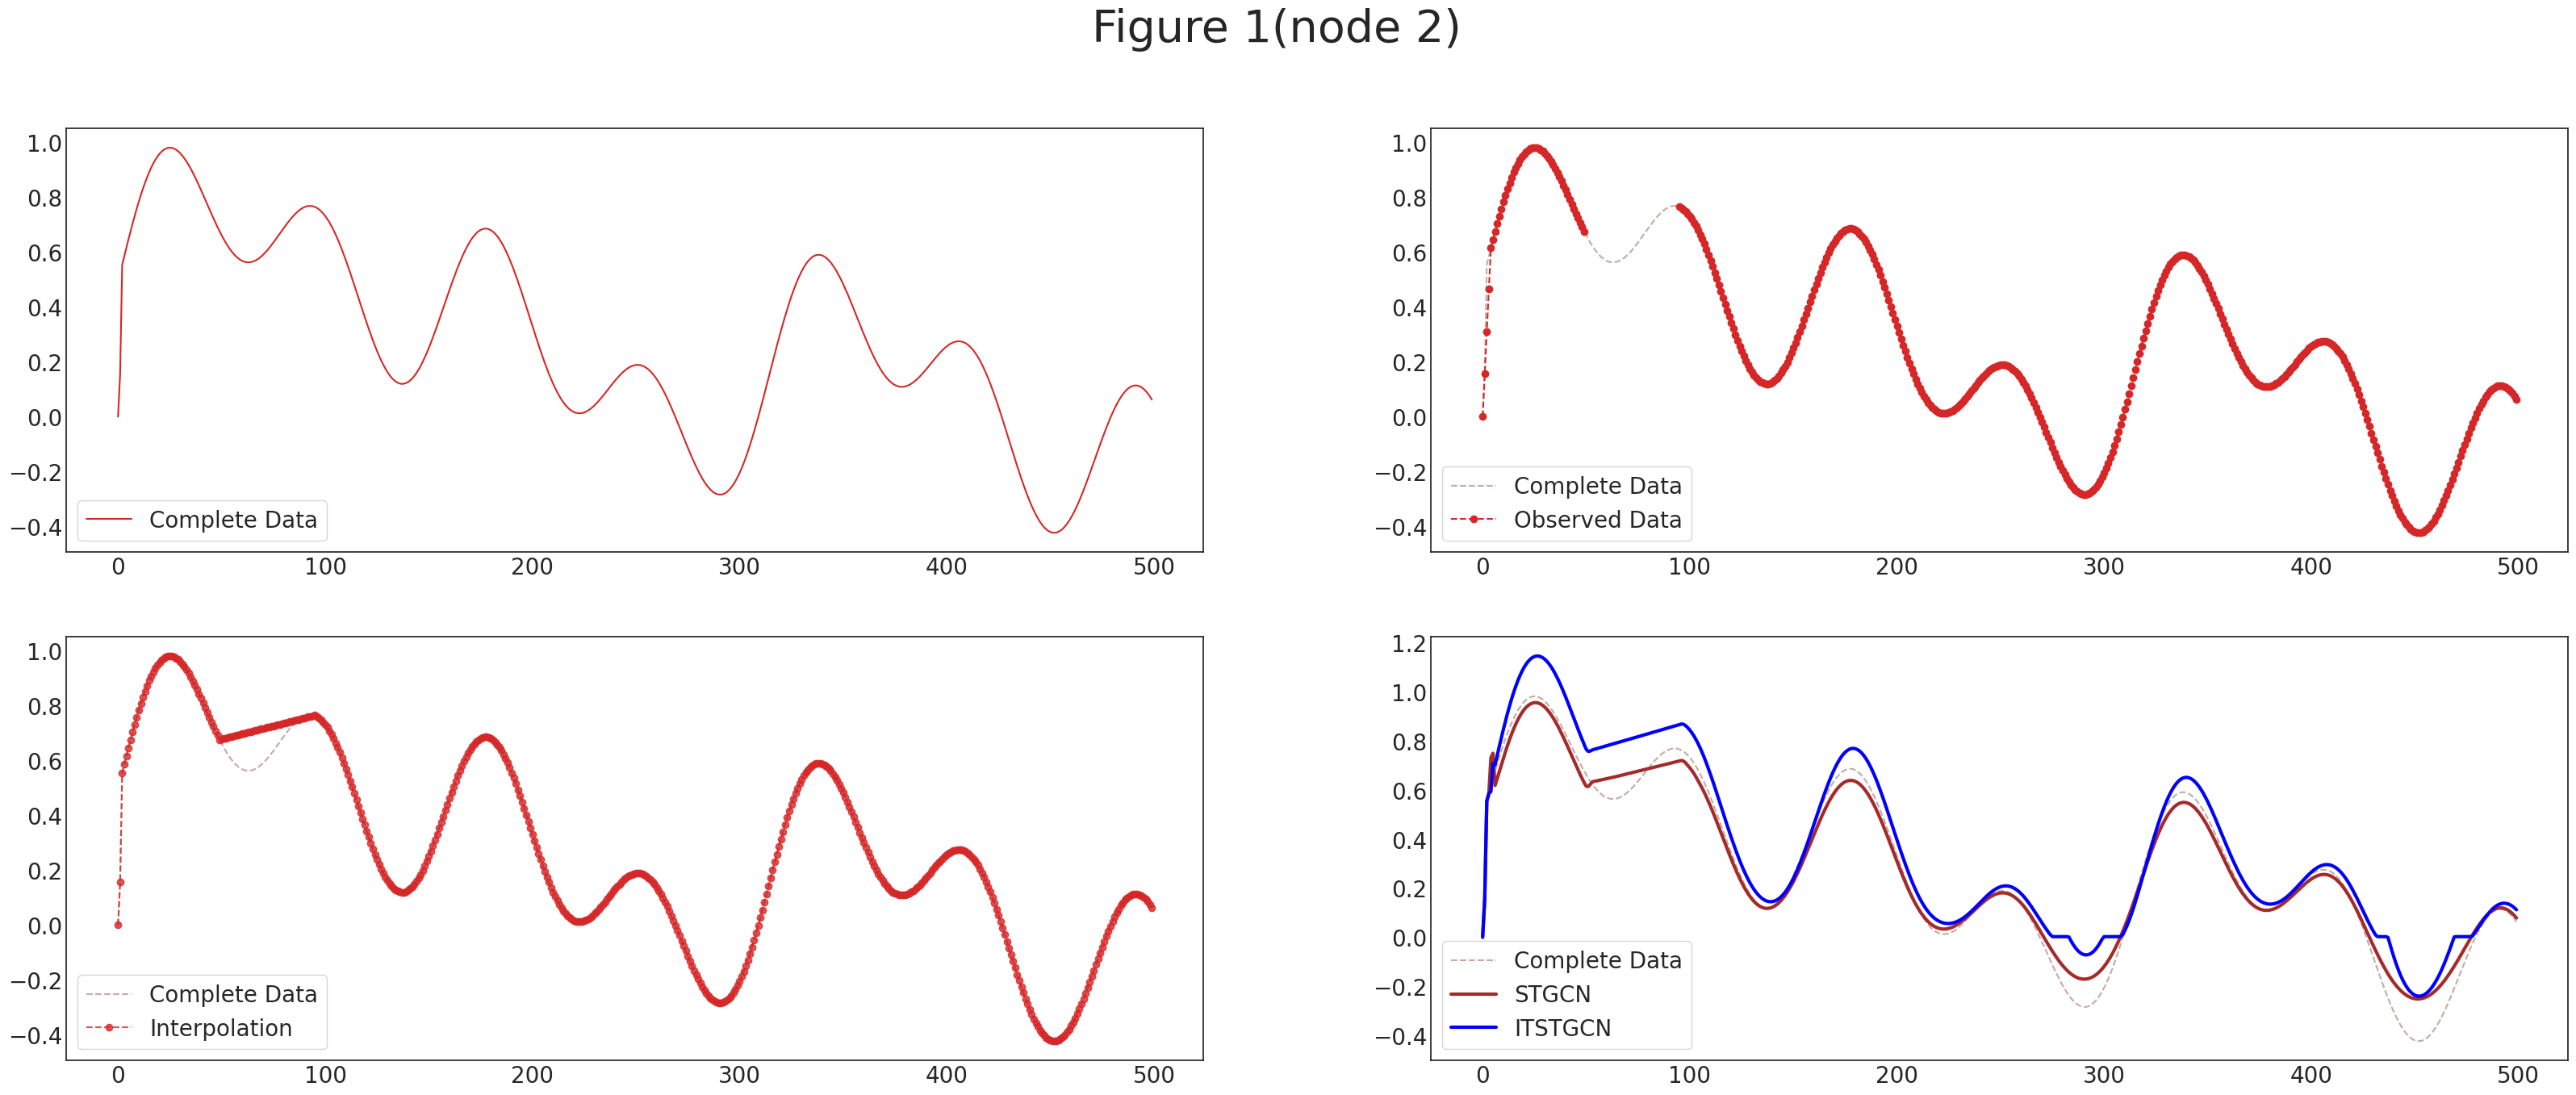
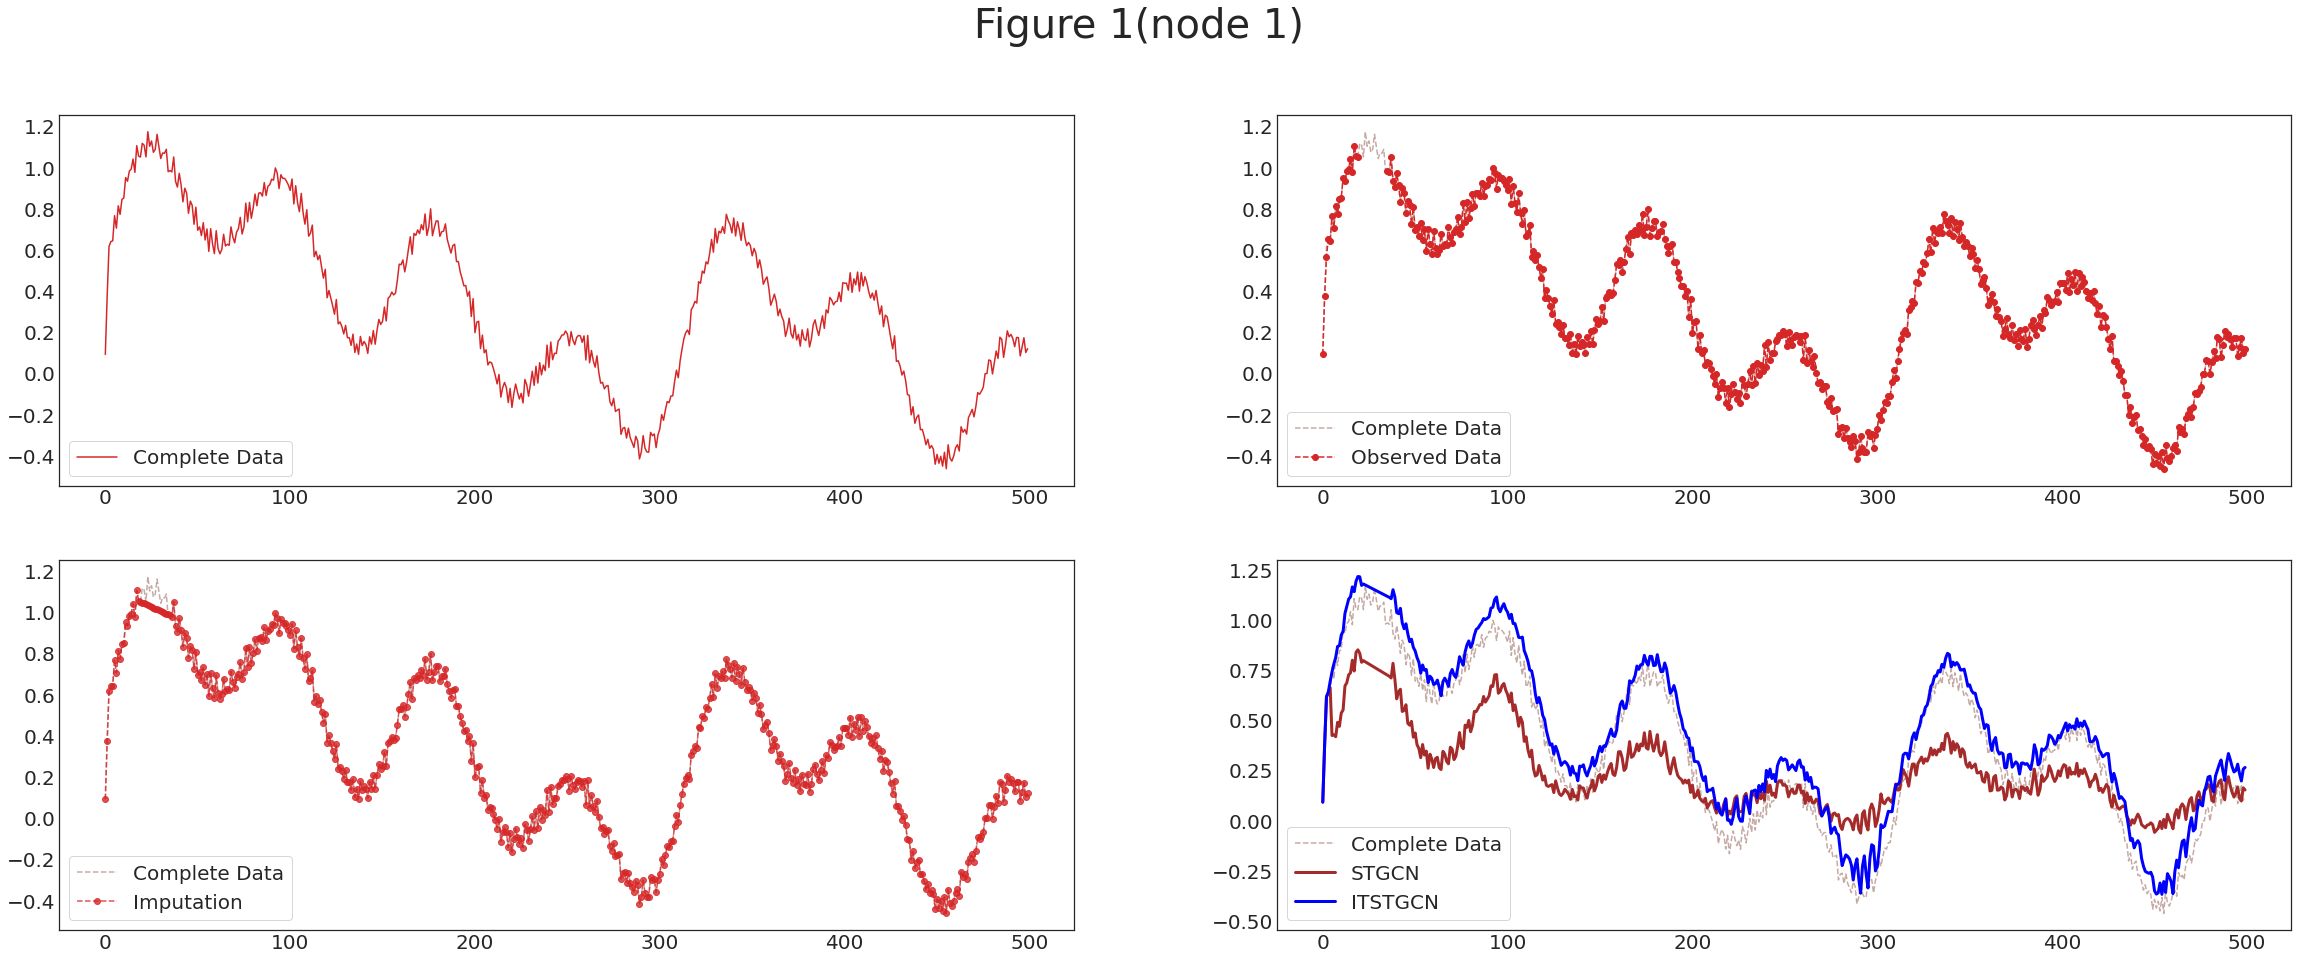
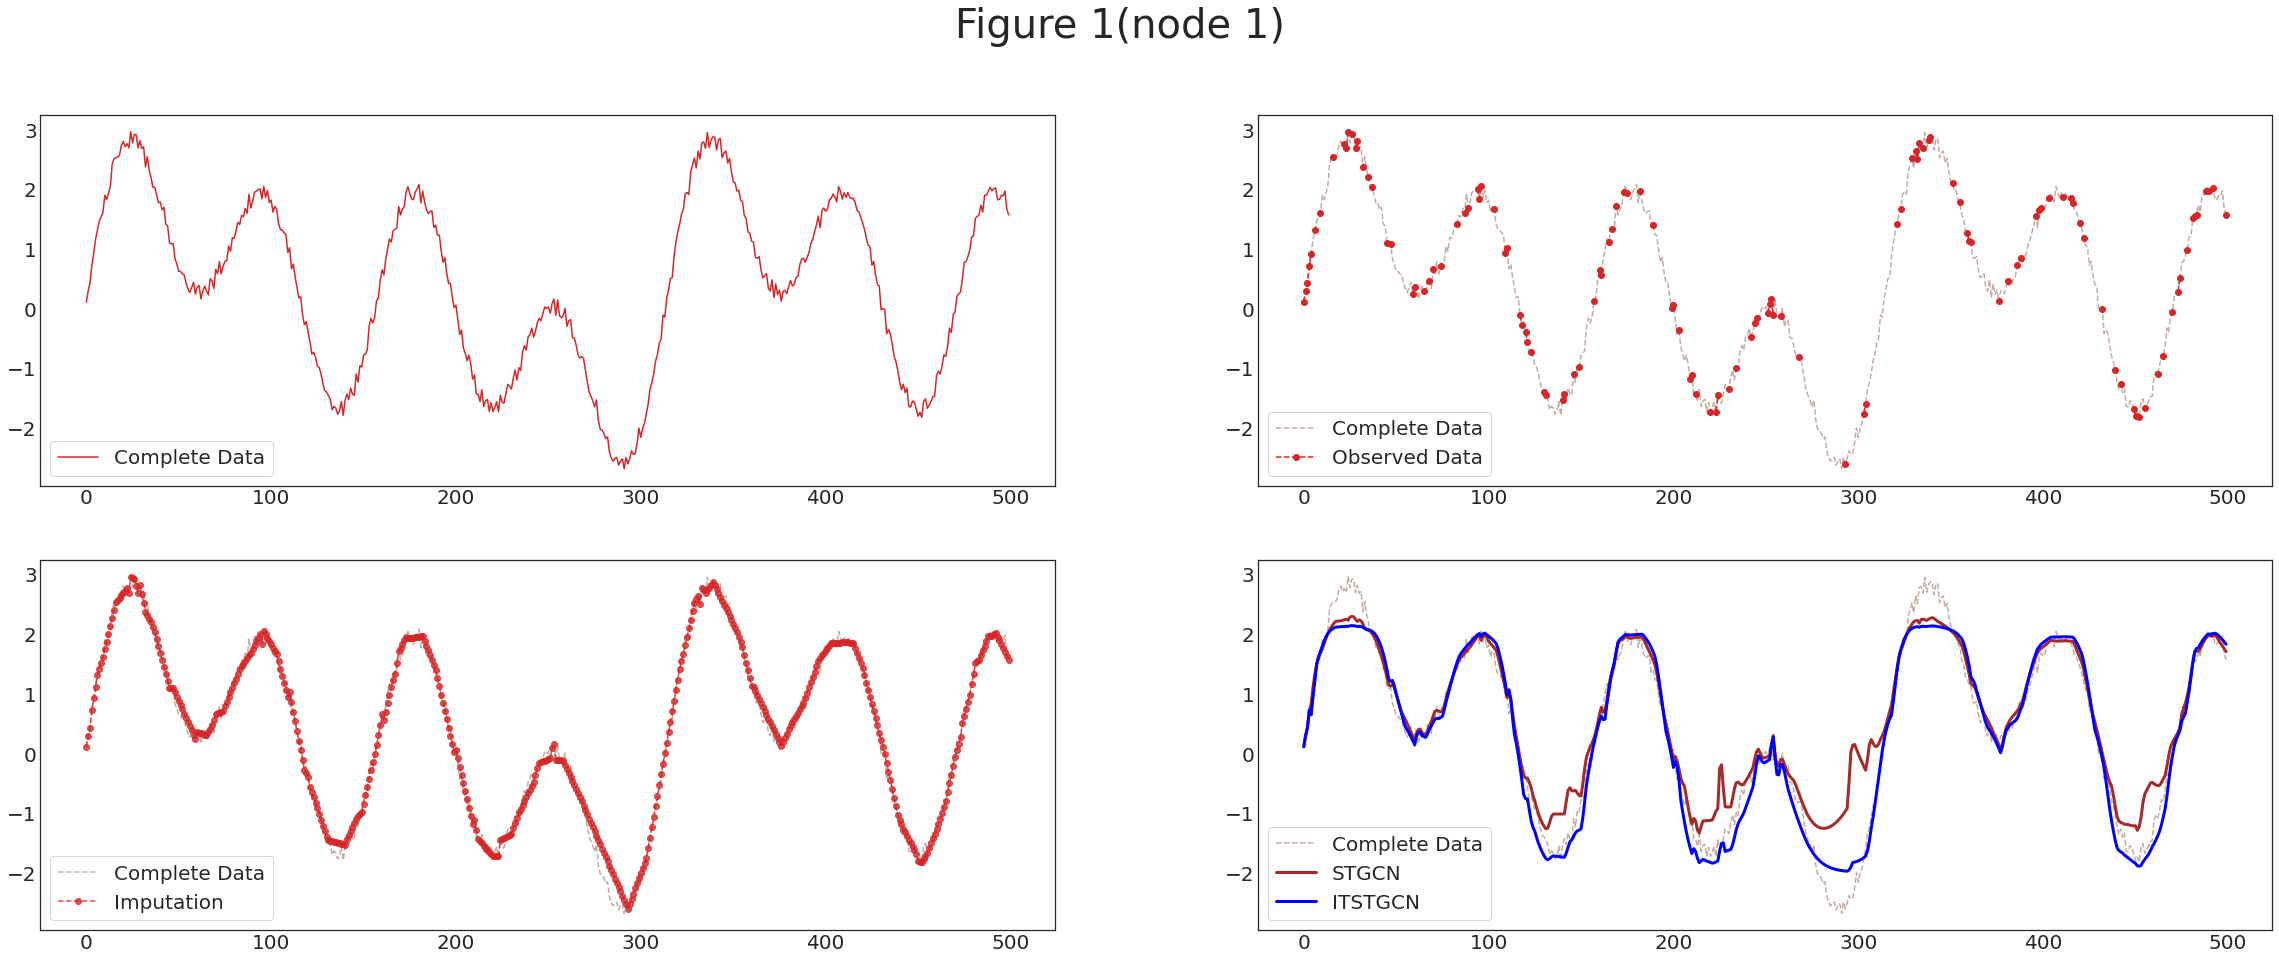
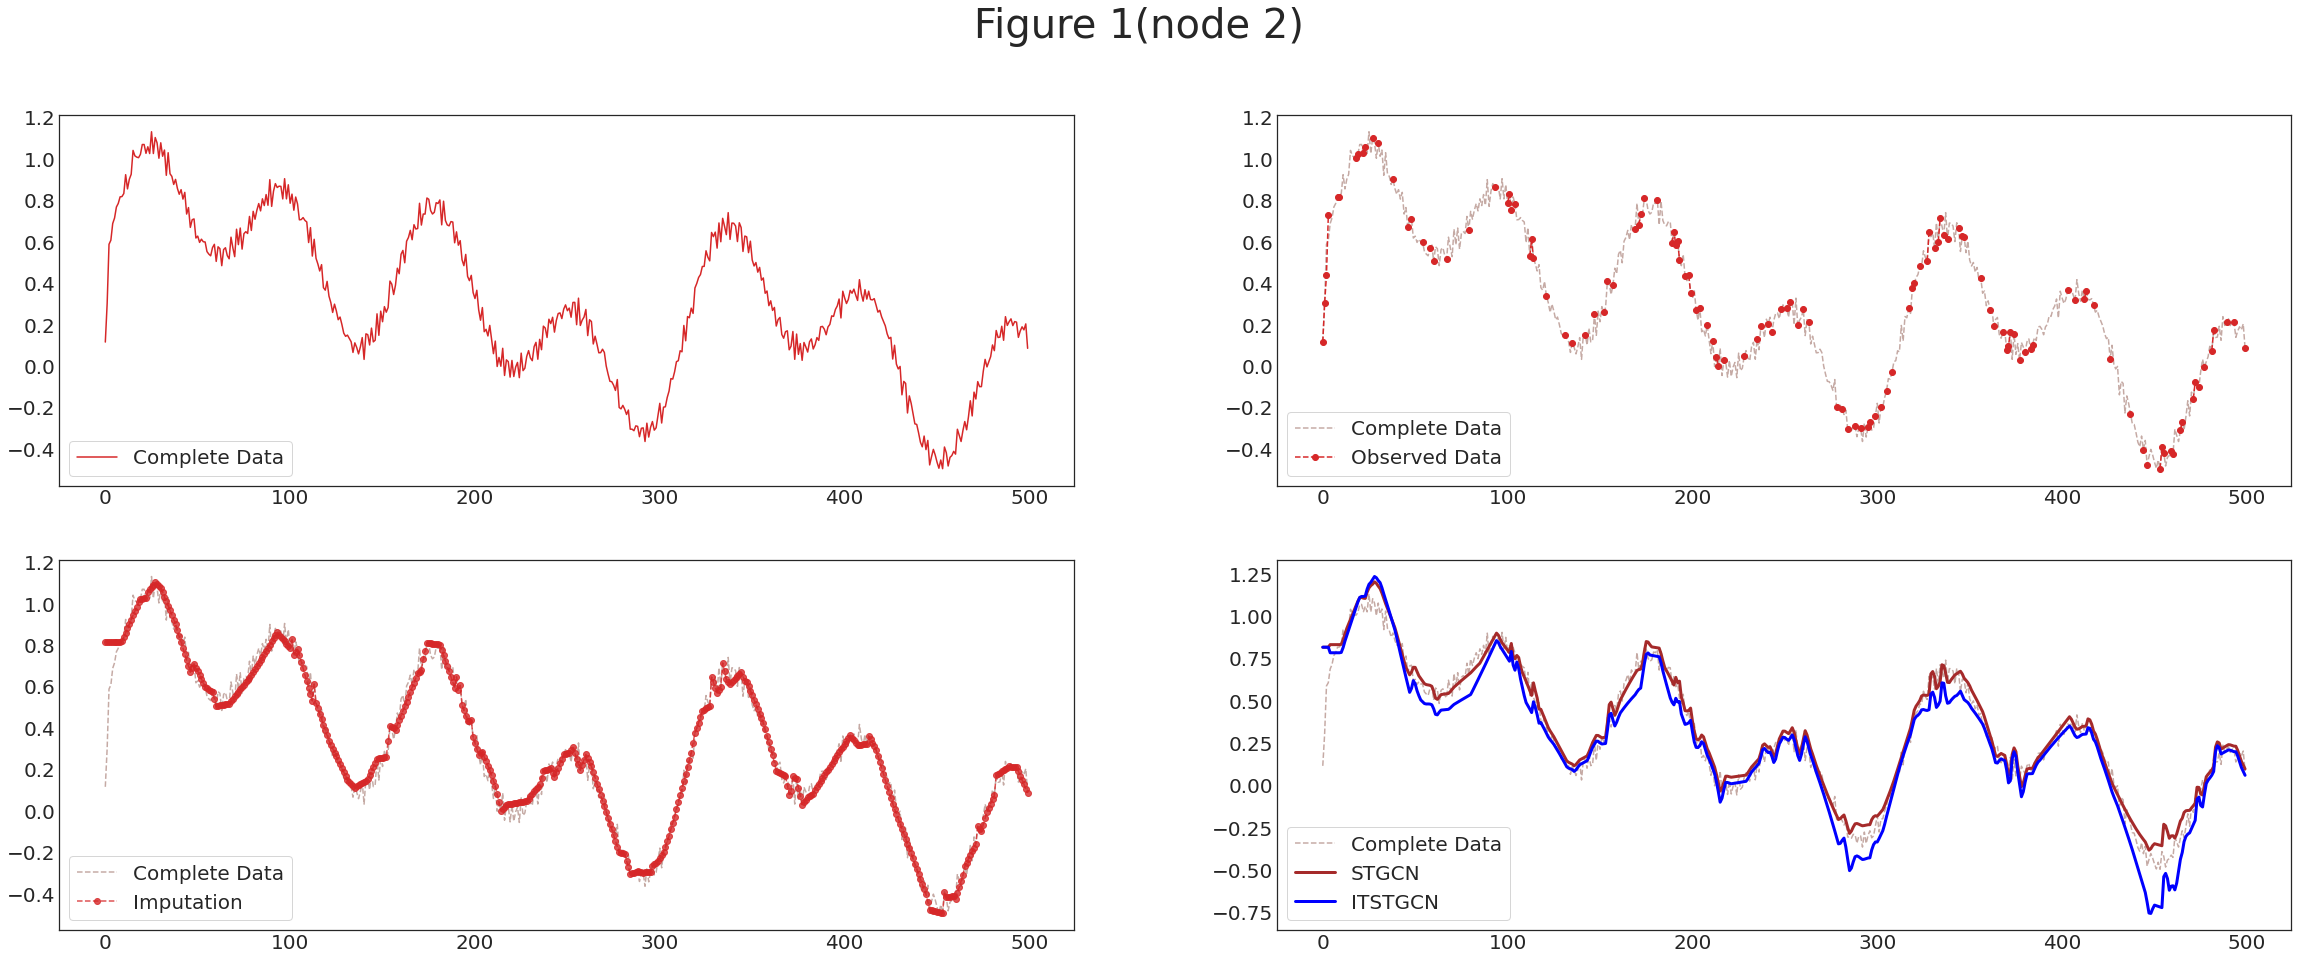
fig.suptitle('Figure 1(node 2)',fontsize=40)
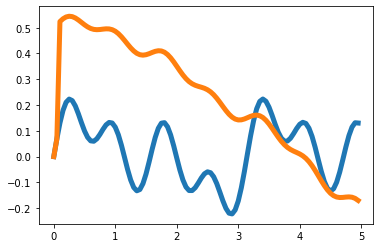
ax1.plot(torch.tensor(_dataset.features)[:,1,0],'-',color='C3',label='Complete Data')
ax1.legend(fontsize=20,loc='lower left',facecolor='white', frameon=True)
ax1.tick_params(axis='y', labelsize=20)
ax1.tick_params(axis='x', labelsize=20)
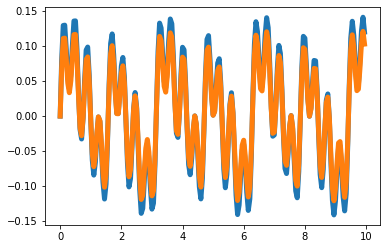
ax2.plot(torch.tensor(_dataset.features)[:,1,0],'--',color='C5',alpha=0.5,label='Complete Data')
ax2.plot(torch.cat([torch.tensor(_dataset.features)[:2,1,0],torch.tensor(_dataset_miss.targets).reshape(-1,5)[:,1]],dim=0),'--o',color='C3',label='Observed Data')
ax2.legend(fontsize=20,loc='lower left',facecolor='white', frameon=True)
ax2.tick_params(axis='y', labelsize=20)
ax2.tick_params(axis='x', labelsize=20)
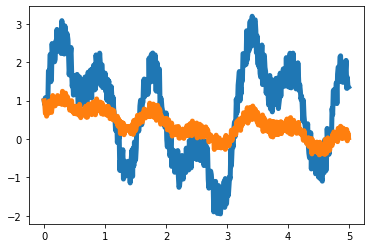
ax3.plot(torch.tensor(_dataset.features)[:,1,0],'--',color='C5',alpha=0.5,label='Complete Data')
ax3.plot(_evtor_2.f_tr[:,1],'--o',color='C3',alpha=0.8,label='Interpolation')
ax3.legend(fontsize=20,loc='lower left',facecolor='white', frameon=True)
ax3.tick_params(axis='y', labelsize=20)
ax3.tick_params(axis='x', labelsize=20)
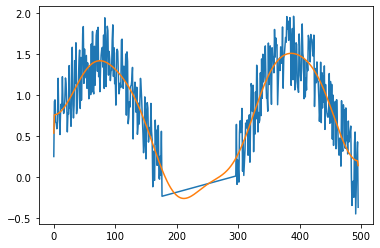
ax4.plot(torch.tensor(_dataset.features)[:,1,0],'--',color='C5',alpha=0.5,label='Complete Data')
ax4.plot(_evtor.fhat_tr[:,1],color='brown',lw=3,label='STGCN')
ax4.plot(_evtor_2.fhat_tr[:,1],color='blue',lw=3,label='ITSTGCN')
# ax4.plot(55, 0, 'o', markersize=100, markerfacecolor='none', markeredgecolor='red',markeredgewidth=3)
# ax4.plot(150, 0, 'o', markersize=80, markerfacecolor='none', markeredgecolor='red',markeredgewidth=3)
# ax4.plot(185, 0, 'o', markersize=80, markerfacecolor='none', markeredgecolor='red',markeredgewidth=3)
ax4.legend(fontsize=20,loc='lower left',facecolor='white', frameon=True)
ax4.tick_params(axis='y', labelsize=20)
ax4.tick_params(axis='x', labelsize=20)
# plt.savefig('try2_node2.png')