import tqdm
import numpy as np
import pandas as pd
import matplotlib.pyplot as plt
import plotly.express as px
import warnings
warnings.simplefilter("ignore", np.ComplexWarning)
from haversine import haversine
from IPython.display import HTML
import plotly.graph_objects as goEarthquake
GODE
Real analysis
imports
import rpy2
import rpy2.robjects as ro
from rpy2.robjects.vectors import FloatVector
from rpy2.robjects.packages import importr
load data and clean it
- load
df= pd.read_csv('https://raw.githubusercontent.com/plotly/datasets/master/earthquakes-23k.csv')
df| Date | Latitude | Longitude | Magnitude | |
|---|---|---|---|---|
| 0 | 01/02/1965 | 19.2460 | 145.6160 | 6.0 |
| 1 | 01/04/1965 | 1.8630 | 127.3520 | 5.8 |
| 2 | 01/05/1965 | -20.5790 | -173.9720 | 6.2 |
| 3 | 01/08/1965 | -59.0760 | -23.5570 | 5.8 |
| 4 | 01/09/1965 | 11.9380 | 126.4270 | 5.8 |
| ... | ... | ... | ... | ... |
| 23407 | 12/28/2016 | 38.3917 | -118.8941 | 5.6 |
| 23408 | 12/28/2016 | 38.3777 | -118.8957 | 5.5 |
| 23409 | 12/28/2016 | 36.9179 | 140.4262 | 5.9 |
| 23410 | 12/29/2016 | -9.0283 | 118.6639 | 6.3 |
| 23411 | 12/30/2016 | 37.3973 | 141.4103 | 5.5 |
23412 rows × 4 columns
df_korea= pd.read_csv('earthquake_korea2.csv').iloc[:,[1,2,5,6]].rename(columns={'규모':'Magnitude'})https://www.weather.go.kr/w/eqk-vol/search/korea.do?schOption=&xls=0&startTm=2012-01-02&endTm=2022-06-17&startSize=2&endSize=&startLat=&endLat=&startLon=&endLon=&lat=&lon=&dist=&keyword=&dpType=m
df_global= pd.concat([pd.read_csv('00_05.csv'),pd.read_csv('05_10.csv'),pd.read_csv('10_15.csv'),pd.read_csv('15_20.csv')]).iloc[:,[0,1,2,4]].rename(columns={'latitude':'Latitude','longitude':'Longitude','mag':'Magnitude'}).reset_index().iloc[:,1:]https://www.usgs.gov/programs/earthquake-hazards/lists-maps-and-statistics
- cleaning
df.Date[df.Date == '1975-02-23T02:58:41.000Z']3378 1975-02-23T02:58:41.000Z
Name: Date, dtype: objectdf.iloc[3378,0] = '02/03/1975'df.Date[df.Date == '1985-04-28T02:53:41.530Z']7512 1985-04-28T02:53:41.530Z
Name: Date, dtype: objectdf.iloc[7512,0] = '04/28/1985'df.Date[df.Date == '2011-03-13T02:23:34.520Z']20650 2011-03-13T02:23:34.520Z
Name: Date, dtype: objectdf.iloc[20650,0] = '03/13/2011'df= df.assign(Year=list(map(lambda x: x.split('/')[-1], df.Date))).iloc[:,1:]
df| Latitude | Longitude | Magnitude | Year | |
|---|---|---|---|---|
| 0 | 19.2460 | 145.6160 | 6.0 | 1965 |
| 1 | 1.8630 | 127.3520 | 5.8 | 1965 |
| 2 | -20.5790 | -173.9720 | 6.2 | 1965 |
| 3 | -59.0760 | -23.5570 | 5.8 | 1965 |
| 4 | 11.9380 | 126.4270 | 5.8 | 1965 |
| ... | ... | ... | ... | ... |
| 23407 | 38.3917 | -118.8941 | 5.6 | 2016 |
| 23408 | 38.3777 | -118.8957 | 5.5 | 2016 |
| 23409 | 36.9179 | 140.4262 | 5.9 | 2016 |
| 23410 | -9.0283 | 118.6639 | 6.3 | 2016 |
| 23411 | 37.3973 | 141.4103 | 5.5 | 2016 |
23412 rows × 4 columns
df.Year = df.Year.astype(np.float64)df_korea = df_korea.assign(Year=list(map(lambda x: x.split('/')[0], df_korea.발생시각))).iloc[:,1:]
df_korea = df_korea.assign(Latitude=list(map(lambda x: x.split(' ')[0], df_korea.위도))).iloc[:,[0,2,3,4]]
df_korea = df_korea.assign(Longitude=list(map(lambda x: x.split(' ')[0], df_korea.경도))).iloc[:,[0,2,3,4]]df_global = df_global.assign(Year=list(map(lambda x: x.split('-')[0], df_global.time))).iloc[:,1:]df_korea.Year = df_korea.Year.astype(np.float64)
df_korea.Latitude = df_korea.Latitude.astype(np.float64)
df_korea.Longitude = df_korea.Longitude.astype(np.float64)
df_global.Year = df_global.Year.astype(np.float64)define class
class MooYaHo:
    def __init__(self,df):
        self.df = df
        self.f = df.Magnitude.to_numpy()
        self.year = df.Year.to_numpy()
        self.lat = df.Latitude.to_numpy()
        self.long = df.Longitude.to_numpy()
        self.n = len(self.f)

        self.theta= None
    def get_distance(self):
        self.D = np.zeros([self.n,self.n])
        locations = np.stack([self.lat, self.long],axis=1)
        for i in tqdm.tqdm(range(self.n)):
            for j in range(i,self.n):
                self.D[i,j]=haversine(locations[i],locations[j])
        self.D = self.D+self.D.T
    def get_weightmatrix(self,theta=1,beta=0.5,kappa=4000):
        self.theta = theta
        dist = np.where(self.D<kappa,self.D,0)
        self.W = np.exp(-(dist/self.theta)**2)

    def _eigen(self):
        d= self.W.sum(axis=1)
        D= np.diag(d)
        self.L = np.diag(1/np.sqrt(d)) @ (D-self.W) @ np.diag(1/np.sqrt(d))
        self.lamb, self.Psi = np.linalg.eigh(self.L)
        self.Lamb = np.diag(self.lamb)
    def fit(self,m):
        self._eigen()
        self.fhat = self.Psi[:,0:m]@self.Psi[:,0:m].T@self.f
        self.df = self.df.assign(MagnitudeHat = self.fhat)
        self.df = self.df.assign(Residual = self.df.Magnitude- self.df.MagnitudeHat)
        plt.plot(self.f,'.')
        plt.plot(self.fhat,'x')

    def vis(self,MagThresh=7,ResThresh=1):
        fig = px.density_mapbox(self.df,
                        lat='Latitude',
                        lon='Longitude',
                        z='Magnitude',
                        radius=5,
                        center=dict(lat=37, lon=160),
                        zoom=1.5,
                        height=900,
                        opacity = 0.4,
                        mapbox_style="stamen-terrain",
                        range_color=[-7,7])
        fig.update_layout(margin={"r":0,"t":0,"l":0,"b":0})
        fig.add_scattermapbox(lat = self.df.query('Magnitude > @MagThresh')['Latitude'],
                      lon = self.df.query('Magnitude > @MagThresh')['Longitude'],
                      text = self.df.query('Magnitude > @MagThresh')['Magnitude'],
                      marker_size= 8,
                      marker_color= 'red',
                      opacity = 0.6
                      )
        fig.add_scattermapbox(lat = self.df.query('Residual**2 > @ResThresh')['Latitude'],
                      lon = self.df.query('Residual**2 > @ResThresh')['Longitude'],
                      text = self.df.query('Magnitude > @ResThresh')['Magnitude'],
                      marker_size= 8,
                      marker_color= 'blue',
                      opacity = 0.5
                      )
        return HTML(fig.to_html(include_mathjax=False, config=dict({'scrollZoom':False})))
    def visf(self):
        fig = px.density_mapbox(self.df,
                        lat='Latitude',
                        lon='Longitude',
                        z='Magnitude',
                        radius=5,
                        center=dict(lat=37, lon=160),
                        zoom=1.5,
                        height=900,
                        opacity = 0.7,
                        mapbox_style="stamen-terrain",
                        range_color=[-7,7])
        fig.update_layout(margin={"r":0,"t":0,"l":0,"b":0})
        return HTML(fig.to_html(include_mathjax=False, config=dict({'scrollZoom':False})))
    def visfhat(self):
        fig = px.density_mapbox(self.df,
                        lat='Latitude',
                        lon='Longitude',
                        z='MagnitudeHat',
                        radius=5,
                        center=dict(lat=37, lon=160),
                        zoom=1.5,
                        height=900,
                        opacity = 0.7,
                        mapbox_style="stamen-terrain",
                        range_color=[-7,7])
        fig.update_layout(margin={"r":0,"t":0,"l":0,"b":0})
        return HTML(fig.to_html(include_mathjax=False, config=dict({'scrollZoom':False})))
    def visres(self,MagThresh=7,ResThresh=1):
        fig = px.density_mapbox(self.df,
                        lat='Latitude',
                        lon='Longitude',
                        z=[0] * len(self.df),
                        radius=5,
                        center=dict(lat=37, lon=160),
                        zoom=1.5,
                        height=900,
                        opacity = 0.7,
                        mapbox_style="stamen-terrain",
                        range_color=[-7,7])
        fig.update_layout(margin={"r":0,"t":0,"l":0,"b":0})
        fig.add_scattermapbox(lat = self.df.query('Residual**2 > @ResThresh')['Latitude'],
                      lon = self.df.query('Residual**2 > @ResThresh')['Longitude'],
                      text = self.df.query('Magnitude > @ResThresh')['Magnitude'],
                      marker_size= 8,
                      marker_color= 'blue',
                      opacity = 0.7
                      )
        return HTML(fig.to_html(include_mathjax=False, config=dict({'scrollZoom':False})))
class MooYaHo2(MooYaHo): # ebayesthresh 기능추가
def fit2(self,ref=0.5): # fit with ebayesthresh
self._eigen()
self.fbar = self.Psi.T @ self.f # fbar := graph fourier transform of f
self.power = self.fbar**2
ebayesthresh = importr('EbayesThresh').ebayesthresh
self.power_threshed=np.array(ebayesthresh(FloatVector(self.fbar**2)))
self.fbar_threshed = np.where(self.power_threshed>0,self.fbar,0)
self.fhat = self.Psi@self.fbar_threshed
self.df = self.df.assign(MagnitudeHat = self.fhat)
self.df = self.df.assign(Residual = self.df.Magnitude- self.df.MagnitudeHat)
self.con = np.where(self.df.Residual>0.7,1,0)
#plt.plot(self.f,'.')
#plt.plot(self.fhat,'x')
# fig, axs = plt.subplots(2,2,figsize=(16,10))
# axs[0,0].plot(self.f,'b')
# axs[0,0].set_title('Magnitude')
# axs[0,0].set_ylim([4.5,9])
# axs[0,1].plot(self.fhat,'k')
# axs[0,1].set_title('MagnitudeHat')
# axs[0,1].set_ylim([4.5,9])
# axs[1,0].plot(self.con,'r*')
# axs[1,0].set_title('Residual square')
# axs[1,1].plot(self.f,'b')
# axs[1,1].plot(self.fhat,'k')
# axs[1,1].plot(self.con,'r*')
# axs[1,1].set_title('Graph')
# axs[1,1].set_ylim([4.5,9])
# plt.tight_layout()
# plt.show()class MooYaHo3(MooYaHo2):
def vis(self,MagThresh=7,ResThresh=1):
fig = px.density_mapbox(self.df,
lat='Latitude',
lon='Longitude',
z='Magnitude',
radius=5,
center=dict(lat=37, lon=126),
zoom=5.7,
height=900,
opacity = 0.3,
mapbox_style="stamen-terrain")
fig.update_layout(margin={"r":0,"t":0,"l":0,"b":0})
fig.add_scattermapbox(lat = self.df.query('Magnitude > @MagThresh')['Latitude'],
lon = self.df.query('Magnitude > @MagThresh')['Longitude'],
text = self.df.query('Magnitude > @MagThresh')['Magnitude'],
marker_size= 8,
marker_color= 'red',
opacity = 0.5
)
fig.add_scattermapbox(lat = self.df.query('Residual**2 > @ResThresh')['Latitude'],
lon = self.df.query('Residual**2 > @ResThresh')['Longitude'],
text = self.df.query('Magnitude > @ResThresh')['Magnitude'],
marker_size= 8,
marker_color= 'blue',
opacity = 0.5
)
return HTML(fig.to_html(include_mathjax=False, config=dict({'scrollZoom':False}))) ebayesthresh = importr('EbayesThresh').ebayesthreshanalysis_df_global(2010~2015)
- make instance for analysis
moo_global=MooYaHo2(df_global.query("2010 <= Year < 2015"))- get distance
moo_global.get_distance()100%|██████████| 10762/10762 [05:32<00:00, 32.36it/s] moo_global.D[moo_global.D>0].mean()8746.68756693945plt.hist(moo_global.D[moo_global.D>0])(array([10857854., 11686138., 15883516., 16913862., 14592080., 12938904.,
11847394., 9636694., 9649504., 1799146.]),
array([8.97930163e-02, 2.00141141e+03, 4.00273303e+03, 6.00405465e+03,
8.00537626e+03, 1.00066979e+04, 1.20080195e+04, 1.40093411e+04,
1.60106627e+04, 1.80119844e+04, 2.00133060e+04]),
<BarContainer object of 10 artists>)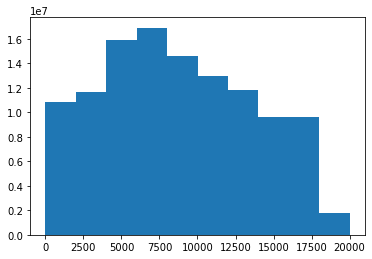
- weight matrix
moo_global.get_weightmatrix(theta=(8810.865423093777),kappa=2500) - fit
moo_global.fit2()moo_global.df.sort_values("Residual",ascending=False).iloc[:40,:]| Latitude | Longitude | Magnitude | Year | MagnitudeHat | Residual | |
|---|---|---|---|---|---|---|
| 30311 | 38.2970 | 142.3730 | 9.1 | 2011.0 | 7.625067 | 1.474933 |
| 11094 | -36.1220 | -72.8980 | 8.8 | 2010.0 | 7.638469 | 1.161531 |
| 32803 | -36.1220 | -72.8980 | 8.8 | 2010.0 | 7.789231 | 1.010769 |
| 32436 | -36.2170 | -73.2570 | 6.7 | 2010.0 | 5.841501 | 0.858499 |
| 26564 | 14.1290 | -92.1640 | 6.5 | 2012.0 | 5.653542 | 0.846458 |
| 27513 | 0.8020 | 92.4630 | 8.2 | 2012.0 | 7.368113 | 0.831887 |
| 30347 | 38.4350 | 142.8420 | 7.3 | 2011.0 | 6.490603 | 0.809397 |
| 30296 | 36.2810 | 141.1110 | 7.9 | 2011.0 | 7.156346 | 0.743654 |
| 10292 | 7.8810 | 91.9360 | 7.5 | 2010.0 | 6.766319 | 0.733681 |
| 9193 | 26.9010 | 143.6980 | 7.4 | 2010.0 | 6.667897 | 0.732103 |
| 32554 | -36.6650 | -73.3740 | 6.6 | 2010.0 | 5.873441 | 0.726559 |
| 30301 | 38.9690 | 143.3700 | 6.7 | 2011.0 | 5.984234 | 0.715766 |
| 32001 | 7.8810 | 91.9360 | 7.5 | 2010.0 | 6.793936 | 0.706064 |
| 31229 | -3.4870 | 100.0820 | 7.8 | 2010.0 | 7.100594 | 0.699406 |
| 28229 | 37.3650 | 141.3680 | 6.1 | 2011.0 | 5.403952 | 0.696048 |
| 9283 | -56.4120 | -25.7410 | 6.3 | 2010.0 | 5.607381 | 0.692619 |
| 9520 | -3.4870 | 100.0820 | 7.8 | 2010.0 | 7.111591 | 0.688409 |
| 30827 | -19.7020 | 167.9470 | 7.3 | 2010.0 | 6.615744 | 0.684256 |
| 30295 | 36.0230 | 142.2690 | 6.6 | 2011.0 | 5.917664 | 0.682336 |
| 27456 | 2.5810 | 90.2690 | 6.2 | 2012.0 | 5.521275 | 0.678725 |
| 30017 | 37.5940 | 142.6480 | 6.5 | 2011.0 | 5.828617 | 0.671383 |
| 10135 | -22.1460 | -68.2160 | 6.3 | 2010.0 | 5.631982 | 0.668018 |
| 24958 | -60.2738 | -46.4011 | 7.7 | 2013.0 | 7.041204 | 0.658796 |
| 10783 | -34.2900 | -71.8910 | 6.9 | 2010.0 | 6.241810 | 0.658190 |
| 29019 | -29.3370 | -177.0510 | 6.0 | 2011.0 | 5.347355 | 0.652645 |
| 32492 | -34.2900 | -71.8910 | 6.9 | 2010.0 | 6.250075 | 0.649925 |
| 30902 | 26.9010 | 143.6980 | 7.4 | 2010.0 | 6.758872 | 0.641128 |
| 28931 | 52.8810 | 108.4400 | 5.3 | 2011.0 | 4.661692 | 0.638308 |
| 29004 | 38.0340 | 143.2640 | 7.0 | 2011.0 | 6.368649 | 0.631351 |
| 30992 | -56.4120 | -25.7410 | 6.3 | 2010.0 | 5.680727 | 0.619273 |
| 30893 | 27.2030 | 143.4550 | 5.3 | 2010.0 | 4.681926 | 0.618074 |
| 9665 | -4.9630 | 133.7600 | 7.0 | 2010.0 | 6.382904 | 0.617096 |
| 29640 | 38.2760 | 141.5880 | 7.1 | 2011.0 | 6.485066 | 0.614934 |
| 26354 | 55.2280 | -134.8591 | 7.5 | 2013.0 | 6.890518 | 0.609482 |
| 27527 | 2.3270 | 93.0630 | 8.6 | 2012.0 | 7.992761 | 0.607239 |
| 25452 | -60.8570 | -25.0700 | 7.3 | 2013.0 | 6.693727 | 0.606273 |
| 29536 | -10.3750 | 161.2000 | 6.8 | 2011.0 | 6.197847 | 0.602153 |
| 26468 | 37.8900 | 143.9490 | 7.3 | 2012.0 | 6.698942 | 0.601058 |
| 32231 | -15.2710 | -173.2190 | 6.1 | 2010.0 | 5.502608 | 0.597392 |
| 26234 | -11.1830 | 164.8820 | 7.1 | 2013.0 | 6.507029 | 0.592971 |
(2010~2014 시도) - 21번째 Ouest Department, Haiti 아이티 지진 2010년 진도 7.0 - 24번째 Puchuncavi, Valparaíso, Chile 칠레 지진 2014년 진도 6.4 - 28번째 Baoxing County, Yaan, Sichuan, China 중국 쓰촨성 지진 2013년 진도 6.6
(2010~2015 시도_결과 좋지 않음?!) - 23번째 2010년 West New Britain Province, Papua New Guinea 진도 7.3 - 24번째 2011년 Kuzawa Terayama, Tanagura, Higashishirakawa District, Fukushima 963-5671, Japan 진도 6.6 - 29번째 2015년 Kishim, Afghanistan 진도 7.5
- vis
#moo_global.visf()#moo_global.visfhat()#moo_global.visres()#moo_global.vis(MagThresh=6.9,ResThresh=0.5)analysis_df_global(2015~2020)
- make instance for analysis
moo_global=MooYaHo2(df_global.query("2015 <= Year <= 2020"))- get distance
moo_global.get_distance()100%|██████████| 11239/11239 [04:35<00:00, 40.84it/s] moo_global.D[moo_global.D>0].mean()8814.318793468068plt.hist(moo_global.D[moo_global.D>0])(array([10894274., 13618924., 16426520., 17583818., 16025000., 15684642.,
13794372., 10946494., 9072574., 2254138.]),
array([2.54728455e-02, 2.00123511e+03, 4.00244475e+03, 6.00365439e+03,
8.00486402e+03, 1.00060737e+04, 1.20072833e+04, 1.40084929e+04,
1.60097026e+04, 1.80109122e+04, 2.00121218e+04]),
<BarContainer object of 10 artists>)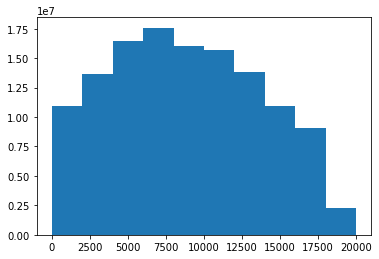
- weight matrix
moo_global.get_weightmatrix(theta=(8814.318793468068),kappa=2500) - fit
moo_global.fit2()moo_global.df.sort_values("Residual",ascending=False).iloc[:30,:]| Latitude | Longitude | Magnitude | Year | MagnitudeHat | Residual | |
|---|---|---|---|---|---|---|
| 21952 | -31.5729 | -71.6744 | 8.3 | 2015.0 | 7.294011 | 1.005989 |
| 36363 | -21.9496 | 169.4266 | 7.5 | 2018.0 | 6.523828 | 0.976172 |
| 36993 | -18.1125 | -178.1530 | 8.2 | 2018.0 | 7.311720 | 0.888280 |
| 39932 | -42.7373 | 173.0540 | 7.8 | 2016.0 | 6.951928 | 0.848072 |
| 36263 | 55.0999 | 164.6993 | 7.3 | 2018.0 | 6.470796 | 0.829204 |
| 35004 | -30.1733 | -177.8625 | 6.1 | 2019.0 | 5.285797 | 0.814203 |
| 41015 | -4.9521 | 94.3299 | 7.8 | 2016.0 | 6.993888 | 0.806112 |
| 21719 | -8.3381 | 124.8754 | 6.5 | 2015.0 | 5.698526 | 0.801474 |
| 33404 | 54.6020 | -159.6258 | 7.6 | 2020.0 | 6.819466 | 0.780534 |
| 41735 | -31.5729 | -71.6744 | 8.3 | 2015.0 | 7.547595 | 0.752405 |
| 40113 | -19.7819 | -178.2443 | 6.9 | 2016.0 | 6.148672 | 0.751328 |
| 41695 | -31.5173 | -71.8040 | 6.7 | 2015.0 | 5.951922 | 0.748078 |
| 37927 | 56.0039 | -149.1658 | 7.9 | 2018.0 | 7.170056 | 0.729944 |
| 36848 | -18.4743 | 179.3502 | 7.9 | 2018.0 | 7.173844 | 0.726156 |
| 21945 | -31.5622 | -71.4262 | 7.0 | 2015.0 | 6.291422 | 0.708578 |
| 41502 | -8.3381 | 124.8754 | 6.5 | 2015.0 | 5.812161 | 0.687839 |
| 33896 | -33.2927 | -177.8571 | 7.4 | 2020.0 | 6.715142 | 0.684858 |
| 22560 | -5.4912 | 151.8715 | 6.0 | 2015.0 | 5.316904 | 0.683096 |
| 39584 | -43.4064 | -73.9413 | 7.6 | 2016.0 | 6.921775 | 0.678225 |
| 36777 | -25.4150 | 178.1991 | 6.5 | 2018.0 | 5.833282 | 0.666718 |
| 35487 | -30.6441 | -178.0995 | 7.3 | 2019.0 | 6.638342 | 0.661658 |
| 39771 | -10.6812 | 161.3273 | 7.8 | 2016.0 | 7.145371 | 0.654629 |
| 38827 | -30.5156 | -178.0563 | 6.0 | 2017.0 | 5.351325 | 0.648675 |
| 41963 | 52.3760 | -169.4458 | 6.9 | 2015.0 | 6.256523 | 0.643477 |
| 22488 | 27.8087 | 86.0655 | 7.3 | 2015.0 | 6.662980 | 0.637020 |
| 21795 | -54.4856 | -135.7080 | 6.1 | 2015.0 | 5.468025 | 0.631975 |
| 22839 | -10.7598 | 164.1216 | 6.1 | 2015.0 | 5.468139 | 0.631861 |
| 41423 | 38.6700 | 20.6000 | 6.5 | 2015.0 | 5.874436 | 0.625564 |
| 36101 | -30.0404 | -71.3815 | 6.7 | 2019.0 | 6.081398 | 0.618602 |
| 36602 | -21.7427 | 169.5217 | 6.5 | 2018.0 | 5.882525 | 0.617475 |
바다 아닌 거 - 8번째 2016년 Rotherham, New Zealand 뉴질랜드 카이코우라 지진 진도 7.8 - 9번째 2015년 Langkuru Utara, Pureman, Alor Regency, East Nusa Tenggara, Indonesia 수마트라 진도 6.5 - 15번째 2018년 Hela Province, Papua New Guinea 파푸아뉴기니 진도 7.5 - 20번째 2015년 Kalinchok, Nepal 네팔 진도 7.3 - 26번째 2019년 Coquimbo, Chile 칠레 코킴보주 진도 6.7
- vis
#moo_global.vis(MagThresh=7,ResThresh=0.3)pd.read_html('https://en.wikipedia.org/wiki/Lists_of_21st-century_earthquakes',encoding='utf-8')[0].query('Magnitude<=7')# List of deadliest earthquakespd.read_html('https://en.wikipedia.org/wiki/Lists_of_21st-century_earthquakes',encoding='utf-8')[3] # Deadliest earthquakes by yearclass eachlocation(MooYaHo2):
def haiti(self,MagThresh=7,ResThresh=1,adjzoom=5,adjmarkersize = 40):
fig = px.density_mapbox(self.df,
lat='Latitude',
lon='Longitude',
z='Magnitude',
radius=15,
center=dict(lat=18.4430, lon=-72.5710),
zoom= adjzoom,
height=900,
opacity = 0.8,
mapbox_style="stamen-terrain",
range_color=[-3,3])
fig.update_layout(margin={"r":0,"t":0,"l":0,"b":0})
fig.add_scattermapbox(lat = self.df.query('Magnitude > @MagThresh')['Latitude'],
lon = self.df.query('Magnitude > @MagThresh')['Longitude'],
text = self.df.query('Magnitude > @MagThresh')['Magnitude'],
marker_size= 5,
marker_color= 'blue',
opacity = 0.1
)
fig.add_scattermapbox(lat = self.df.query('Residual**2 > @ResThresh')['Latitude'],
lon = self.df.query('Residual**2 > @ResThresh')['Longitude'],
text = self.df.query('Magnitude > @ResThresh')['Magnitude'],
marker_size= adjmarkersize,
marker_color= 'red',
opacity = 0.8
)
fig.add_trace(go.Scattermapbox(
lat=self.df.query('Residual**2 > @ResThresh')['Latitude'],
lon=self.df.query('Residual**2 > @ResThresh')['Longitude'],
mode='markers',
marker=go.scattermapbox.Marker(
size=20,
color='rgb(255, 255, 255)',
opacity=0.4
)
))
return fig
def lquique(self,MagThresh=7,ResThresh=1,adjzoom=5, adjmarkersize= 40):
fig = px.density_mapbox(self.df,
lat='Latitude',
lon='Longitude',
z='Magnitude',
radius=15,
center=dict(lat=-32.6953, lon=-71.4416),
zoom=adjzoom,
height=900,
opacity = 0.8,
mapbox_style="stamen-terrain",
range_color=[-7,7])
fig.update_layout(margin={"r":0,"t":0,"l":0,"b":0})
fig.add_scattermapbox(lat = self.df.query('Magnitude > @MagThresh')['Latitude'],
lon = self.df.query('Magnitude > @MagThresh')['Longitude'],
text = self.df.query('Magnitude > @MagThresh')['Magnitude'],
marker_size= 5,
marker_color= 'blue',
opacity = 0.1
)
fig.add_scattermapbox(lat = self.df.query('Residual**2 > @ResThresh')['Latitude'],
lon = self.df.query('Residual**2 > @ResThresh')['Longitude'],
text = self.df.query('Magnitude > @ResThresh')['Magnitude'],
marker_size= adjmarkersize,
marker_color= 'red',
opacity = 0.8
)
fig.add_trace(go.Scattermapbox(
lat=self.df.query('Residual**2 > @ResThresh')['Latitude'],
lon=self.df.query('Residual**2 > @ResThresh')['Longitude'],
mode='markers',
marker=go.scattermapbox.Marker(
size=20,
color='rgb(255, 255, 255)',
opacity=0.8
)
))
return fig
def sichuan(self,MagThresh=7,ResThresh=1,adjzoom=5,adjmarkersize=40):
fig = px.density_mapbox(self.df,
lat='Latitude',
lon='Longitude',
z='Magnitude',
radius=15,
center=dict(lat=30.3080, lon=102.8880),
zoom=adjzoom,
height=900,
opacity = 0.6,
mapbox_style="stamen-terrain",
range_color=[-7,7])
fig.update_layout(margin={"r":0,"t":0,"l":0,"b":0})
fig.add_scattermapbox(lat = self.df.query('Magnitude > @MagThresh')['Latitude'],
lon = self.df.query('Magnitude > @MagThresh')['Longitude'],
text = self.df.query('Magnitude > @MagThresh')['Magnitude'],
marker_size= 5,
marker_color= 'blue',
opacity = 0.1
)
fig.add_scattermapbox(lat = self.df.query('Residual**2 > @ResThresh')['Latitude'],
lon = self.df.query('Residual**2 > @ResThresh')['Longitude'],
text = self.df.query('Magnitude > @ResThresh')['Magnitude'],
marker_size= adjmarkersize,
marker_color= 'red',
opacity = 0.8
)
fig.add_trace(go.Scattermapbox(
lat=self.df.query('Residual**2 > @ResThresh')['Latitude'],
lon=self.df.query('Residual**2 > @ResThresh')['Longitude'],
mode='markers',
marker=go.scattermapbox.Marker(
size=20,
color='rgb(255, 255, 255)',
opacity=0.8
)
))
return fig each_location=eachlocation(df_global.query("2010 <= Year < 2015"))- get distance
each_location.get_distance()100%|██████████| 12498/12498 [05:55<00:00, 35.16it/s] each_location.D[each_location.D>0].mean()8810.865423093777plt.hist(each_location.D[each_location.D>0])(array([14176290., 16005894., 21186674., 22331128., 19394182., 17548252.,
16668048., 13316436., 12973260., 2582550.]),
array([8.97930163e-02, 2.00141141e+03, 4.00273303e+03, 6.00405465e+03,
8.00537626e+03, 1.00066979e+04, 1.20080195e+04, 1.40093411e+04,
1.60106627e+04, 1.80119844e+04, 2.00133060e+04]),
<BarContainer object of 10 artists>)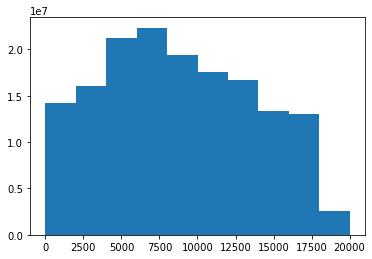
- weight matrix
each_location.get_weightmatrix(theta=(8810.865423093777),kappa=2500) - fit
each_location.fit2()each_location.haiti(MagThresh=6.9,ResThresh=0.5)each_location.lquique(MagThresh=8,ResThresh=0.4,adjzoom=4.3)each_location.sichuan(MagThresh=6.5,ResThresh=0.4)칠레
df_chile_ex= pd.concat([pd.read_csv('05_10.csv'),pd.read_csv('10_15.csv')]).iloc[:,[0,1,2,4]].rename(columns={'latitude':'Latitude','longitude':'Longitude','mag':'Magnitude'}).reset_index().iloc[:,1:]df_chile = df_chile_ex.assign(Year=list(map(lambda x: x.split('-')[0], df_chile_ex.time))).iloc[:,1:]df_chile = df_chile.assign(Month=list(map(lambda x: x.split('-')[1], df_chile_ex.time)))df_chile.Year = df_chile.Year.astype(np.float64)
df_chile.Month = df_chile.Month.astype(np.float64)chile_location=eachlocation(df_chile.query("2010 <= Year < 2015"))chile_location.get_distance()100%|██████████| 12498/12498 [06:28<00:00, 32.19it/s] chile_location.get_weightmatrix(theta=(chile_location.D[chile_location.D>0].mean()),kappa=2500) chile_location.fit2()아이티
chile_location.df.assign(Residual2 = chile_location.df.Residual**2).reset_index().iloc[2324:2330,:]| index | Latitude | Longitude | Magnitude | Year | Month | MagnitudeHat | Residual | Residual2 | |
|---|---|---|---|---|---|---|---|---|---|
| 2324 | 2324 | 18.463 | -72.626 | 5.0 | 2010.0 | 1.0 | 5.105168 | -0.105168 | 0.011060 |
| 2325 | 2325 | 18.387 | -72.784 | 6.0 | 2010.0 | 1.0 | 5.703460 | 0.296540 | 0.087936 |
| 2326 | 2326 | 18.443 | -72.571 | 7.0 | 2010.0 | 1.0 | 6.659386 | 0.340614 | 0.116018 |
| 2327 | 2327 | -5.417 | 133.731 | 5.5 | 2010.0 | 1.0 | 5.604103 | -0.104103 | 0.010837 |
| 2328 | 2328 | 15.437 | -88.761 | 5.1 | 2010.0 | 1.0 | 4.964642 | 0.135358 | 0.018322 |
| 2329 | 2329 | -16.861 | -174.228 | 5.3 | 2010.0 | 1.0 | 5.340902 | -0.040902 | 0.001673 |
칠레
chile_location.df.assign(Residual2 = chile_location.df.Residual**2).reset_index().query("-56.5 < Latitude & Latitude <-17.4 & -81.5 < Longitude & Longitude < -61.5 & Year == 2014 & Month == 8")| index | Latitude | Longitude | Magnitude | Year | Month | MagnitudeHat | Residual | Residual2 | |
|---|---|---|---|---|---|---|---|---|---|
| 2997 | 14603 | -32.6953 | -71.4416 | 6.4 | 2014.0 | 8.0 | 6.088353 | 0.311647 | 0.097124 |
| 2999 | 14605 | -20.1745 | -69.0385 | 5.6 | 2014.0 | 8.0 | 5.553419 | 0.046581 | 0.002170 |
| 3032 | 14638 | -20.1580 | -70.0230 | 5.3 | 2014.0 | 8.0 | 5.251934 | 0.048066 | 0.002310 |
| 3046 | 14652 | -23.9047 | -66.7371 | 5.0 | 2014.0 | 8.0 | 5.210380 | -0.210380 | 0.044260 |
| 3057 | 14663 | -33.7770 | -72.2030 | 5.2 | 2014.0 | 8.0 | 5.065422 | 0.134578 | 0.018111 |
중국
chile_location.df.assign(Residual2 = chile_location.df.Residual**2).reset_index().iloc[5136:5142,:]| index | Latitude | Longitude | Magnitude | Year | Month | MagnitudeHat | Residual | Residual2 | |
|---|---|---|---|---|---|---|---|---|---|
| 5136 | 16742 | 30.209 | 102.862 | 5.0 | 2013.0 | 4.0 | 4.943022 | 0.056978 | 0.003247 |
| 5137 | 16743 | 30.308 | 102.888 | 6.6 | 2013.0 | 4.0 | 5.904218 | 0.695782 | 0.484113 |
| 5138 | 16744 | 39.693 | 143.258 | 5.0 | 2013.0 | 4.0 | 5.118611 | -0.118611 | 0.014068 |
| 5139 | 16745 | 49.965 | 157.652 | 6.1 | 2013.0 | 4.0 | 5.852776 | 0.247224 | 0.061120 |
| 5140 | 16746 | -11.976 | 121.632 | 5.8 | 2013.0 | 4.0 | 5.809708 | -0.009708 | 0.000094 |
| 5141 | 16747 | -14.966 | 166.857 | 5.2 | 2013.0 | 4.0 | 5.145590 | 0.054410 | 0.002960 |