import pandas as pd
import re

import matplotlib.pyplot as plt
import seaborn as snsAn electronic health record (EHR) data example includes both structured data like demographics, diagnoses, and lab results, and unstructured data such as free-text clinical notes and images.
About Dataset
Electronic Health record Dataset
Hello everyone, kindly find below sample dataset containing Patient Id, Patient Demographic (Male, Female, Unknown)
Feel free to analyze the data using various tools.
This dataset contains below columns:
- patientunitstayid, patienthealthsystemstayid: Unique Patient Id
- Patient Demographics:
- gender: Male, Female, Unknown
- age
- ethnicity
- Hospital Details:
- hospitalid: Each hospital was given unique id
- wardid: Ward Id is given in which patient was treated
- apacheadmissiondx: Disease diagnosed
- admissionheight: Height of the patients
- hospitaladmittime24: Admission time to the hospital
- hospitaladmitsource: Department Source of the admission
- hospitaldischargeyear: Discharge year from the hospital
- hospitaldischargetime24: Discharge time from the hospital
- hospitaldischargelocation: Patient Discharge to which location (Home, Death, Other hospital. etc)
- hospitaldischargestatus (Alive, Expired)
Hospital Unit Details:
- unittype: Unit in which admitted
- unitadmittime24: Time of admision to the Unit
- unitadmitsource: Department source for the unit
- unitvisitnumber: No. of times visited
- unitstaytype: Admit, readmit, etc
- admissionweight: Weight during the admission
- dischargeweight: Weight during the Discharge
- unitdischargetime24: Discharge time from the Unit
- unitdischargelocation: Patient Discharge to which location (Home, Death, Other hospital. etc)
- unitdischargestatus: (Alive, Expired)
Date of admission and discharge is not given in the dataset, you can assume it to be 24 hours data.
I have worked on a dashboard assessing no. of patients admitted, avg. duration of hospital stay, disease condition for which they are admitted etc.
You can also do your analysis. Do share your findings with me. Thanks!
1 Patient Identifiers (환자 식별자)
| 변수명 | 설명 |
|---|---|
patientunitstayid |
각 환자의 병동(혹은 ICU 단위) 내 체류에 대한 고유 ID |
patienthealthsystemstayid |
병원 시스템 내 환자의 전체 입원 단위별 고유 ID (한 환자가 여러 unit을 옮길 수 있음) |
2 Patient Demographics (환자 인적정보)
| 변수명 | 설명 |
|---|---|
gender |
성별 — Male, Female, Unknown |
age |
환자 나이 |
ethnicity |
인종/민족 (예: Caucasian, Asian, African American 등) |
3 Hospital Details (병원 전체 입원 정보)
| 변수명 | 설명 |
|---|---|
hospitalid |
병원 고유 ID |
wardid |
병원 내 병동 ID |
apacheadmissiondx |
입원 시 진단명 (예: Sepsis, Stroke 등) |
admissionheight |
환자 키 (cm 또는 m 단위) |
hospitaladmittime24 |
병원 입원 시각 (24시간 형식) |
hospitaladmitsource |
입원 출처 (예: 응급실, 외래, 타 병원 등) |
hospitaldischargeyear |
퇴원 연도 |
hospitaldischargetime24 |
병원 퇴원 시각 (24시간 형식) |
hospitaldischargelocation |
환자가 퇴원 후 이동한 곳 (예: Home, Other hospital, Death 등) |
hospitaldischargestatus |
퇴원 상태 (Alive, Expired 등 생존 여부) |
4 Hospital Unit Details (병원 내 세부 병동/Unit 정보)
| 변수명 | 설명 |
|---|---|
unittype |
입원한 병동/유닛 유형 (예: ICU, General Ward 등) |
unitadmittime24 |
병동 입실 시각 (24시간 형식) |
unitadmitsource |
병동 입실 출처 (예: 응급실, 수술실 등) |
unitvisitnumber |
병동 방문 횟수 (입·재입원 구분 가능) |
unitstaytype |
입원 유형 (Admit, Readmit 등) |
admissionweight |
입원 시 체중 |
dischargeweight |
퇴원 시 체중 |
unitdischargetime24 |
병동 퇴실 시각 |
unitdischargelocation |
병동 퇴실 후 이동 장소 |
unitdischargestatus |
병동 퇴실 상태 (Alive, Expired) |
df = pd.read_csv('../../../delete/EHR.csv')df['operator'] = df['age'].str.replace(r'[0-9.]','',regex=True)df['age_numeric'] = df['age'].str.extract(r'([0-9.]+)').astype(float)gender_missing = (~df['gender'].isin(['Male','Female'])).sum()age_missing = df['age'].isna().sum()df_gender = df[df['gender'].isin(['Male','Female'])]plt.figure(figsize=(8,6))
sns.countplot(data = df_gender, x='gender', palette=['skyblue', 'pink'])
plt.title('')
plt.xlabel('Gender')
plt.ylabel('Count')
plt.text(x=1.1, y=df_gender['gender'].value_counts().max(),
s=f"Missing value: {gender_missing}", ha='left',va='bottom',fontsize=10, color='red',style='italic')
plt.tight_layout()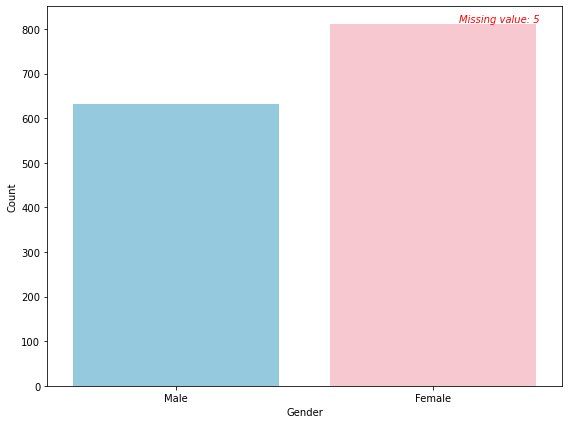
plt.figure(figsize=(10,6))
sns.histplot(df['age_numeric'],bins=20, kde=False,color='lightgrey')
plt.title('')
plt.xlabel('Age')
plt.ylabel('Count')
plt.text(x=30, y=df['age_numeric'].value_counts().max(),
        s=f"Missing value: {age_missing}", ha='right',va='bottom',fontsize=10, color='red',style='italic')
plt.tight_layout()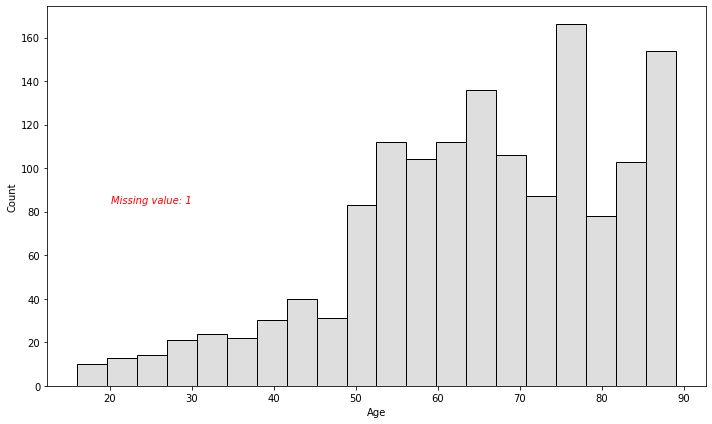
ndarray.size: Number of elements in the array.
df_ethnicity = df[df['ethnicity'].notna() & (df['ethnicity'] != "")].groupby('ethnicity').size().reset_index(name='n')df_ethnicity['prop'] = df_ethnicity['n'] / df_ethnicity['n'].sum()df_ethnicity = df_ethnicity.sort_values('n')plt.figure(figsize=(10,6))
sns.barplot(data = df_ethnicity, y = 'ethnicity',x='n',hue = 'ethnicity',dodge = False,palette='tab20b')
plt.xscale('log')
plt.xlabel('Count (log scale)')
plt.ylabel('Ethnicity')
plt.title('Ethnicity Distribution (logscale)')
plt.legend([],[],frameon=False)
plt.tight_layout()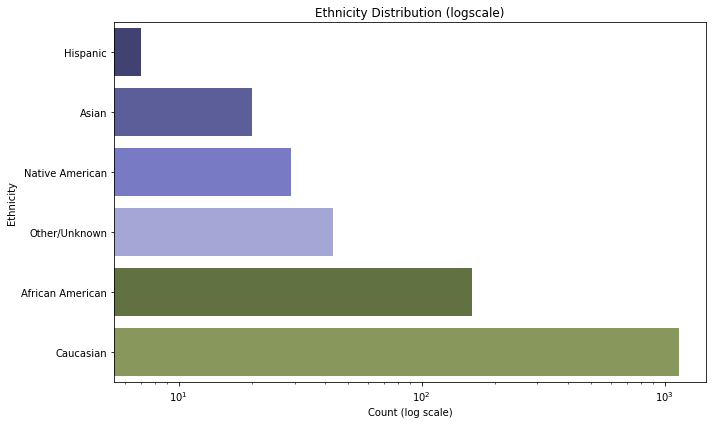
df.head(5)| patientunitstayid | patienthealthsystemstayid | gender | age | ethnicity | hospitalid | wardid | apacheadmissiondx | admissionheight | hospitaladmittime24 | ... | unitstaytype | admissionweight | dischargeweight | unitdischargetime24 | unitdischargeoffset | unitdischargelocation | unitdischargestatus | uniquepid | operator | age_numeric | |
|---|---|---|---|---|---|---|---|---|---|---|---|---|---|---|---|---|---|---|---|---|---|
| 0 | 210014 | 182373 | Male | 45 | Caucasian | 73 | 89 | Hypertension, uncontrolled (for cerebrovascula... | 178.0 | 13:08:59 | ... | admit | 116.0 | 112.7 | 15:00:00 | 4424 | Skilled Nursing Facility | Alive | 002-10665 | 45.0 | |
| 1 | 200026 | 174624 | Male | 50 | Caucasian | 71 | 87 | Ablation or mapping of cardiac conduction pathway | 177.8 | 10:41:00 | ... | admit | 106.1 | 106.1 | 17:40:00 | 1548 | Home | Alive | 002-10715 | 50.0 | |
| 2 | 221131 | 190993 | Male | 83 | Caucasian | 71 | 87 | Endarterectomy, carotid | 175.3 | 21:43:00 | ... | admit | NaN | 72.1 | 17:46:00 | 1203 | Home | Alive | 002-10249 | 83.0 | |
| 3 | 221215 | 191054 | Male | 49 | Caucasian | 71 | 87 | Infarction, acute myocardial (MI) | 185.4 | 03:16:00 | ... | admit | 145.3 | 146.6 | 19:07:00 | 1562 | Home | Alive | 002-10627 | 49.0 | |
| 4 | 217835 | 188445 | Male | 57 | Caucasian | 73 | 92 | CABG alone, coronary artery bypass grafting | 172.7 | 01:09:00 | ... | admit | NaN | 80.4 | 08:25:00 | 4719 | Floor | Alive | 002-10324 | 57.0 |
5 rows × 31 columns