import pandas as pd
import numpy as np

import pingouin as pg

import matplotlib.pyplot as plt
import seaborn as snsImport
Data
np.random.seed(1212)n_groups = 3
n_sub_per_group = 50
groups = ['G1', 'G2', 'G3']
times = ['T1', 'T2', 'T3'] data = []
subject_id = 1
for g in groups:
for _ in range(n_sub_per_group):
subject_effect = np.random.normal(0, 3)
if g == 'G1':
base_mean = 50
elif g == 'G2':
base_mean = 55
else: # G3
base_mean = 60
means_by_time = {
'T1': base_mean,
'T2': base_mean + 5,
'T3': base_mean + 8
}
for t in times:
score = np.random.normal(means_by_time[t] + subject_effect, 5)
data.append([subject_id, g, t, score])
subject_id += 1df = pd.DataFrame(data, columns=['subject', 'group', 'time', 'score'])df.head()| subject | group | time | score | |
|---|---|---|---|---|
| 0 | 1 | G1 | T1 | 55.325018 |
| 1 | 1 | G1 | T2 | 58.587960 |
| 2 | 1 | G1 | T3 | 51.686803 |
| 3 | 2 | G1 | T1 | 51.155675 |
| 4 | 2 | G1 | T2 | 46.891737 |
df.groupby(['group', 'time'])['score'].mean()group time
G1 T1 49.059198
T2 54.496584
T3 57.815065
G2 T1 54.890146
T2 60.616516
T3 62.853200
G3 T1 62.157166
T2 63.992115
T3 67.534879
Name: score, dtype: float64Repeated Measure ANOVA
anova = pg.mixed_anova(
    data=df,
    dv='score',
    within='time',
    between='group',
    subject='subject'
)anova| Source | SS | DF1 | DF2 | MS | F | p-unc | np2 | eps | |
|---|---|---|---|---|---|---|---|---|---|
| 0 | group | 8708.950374 | 2 | 147 | 4354.475187 | 96.426159 | 1.770075e-27 | 0.567459 | NaN |
| 1 | time | 4111.110365 | 2 | 294 | 2055.555183 | 78.371474 | 5.242077e-28 | 0.347744 | 0.990805 |
| 2 | Interaction | 276.972914 | 4 | 294 | 69.243228 | 2.640014 | 3.406025e-02 | 0.034673 | NaN |
Results
- Between-subject effect: group
- F(2,147)=96.43, p < .0001
- The mean differences among the three groups were statistically significant.
- np2 - 0.567 -> Large effect
- The mean baselines of three groups are different.
- The Groups have effective to the Score.
- Within-subject effect: time (Repeated measure factor)
- F(2,294)=78.37, p < .0001
- The mean scores changed significantly over time.
- p = 5.24e-28 -> significant
- np2 = 0.348
- eps = 1 -> sphericity satisfation
- Interaction effect: group × time
F(4,294)=2.64, p = 0.034 -> significant
p = 0.034 -> significant
np2 = 0.035 -> small effect
This indicates that the pattern of change over time differs across groups.
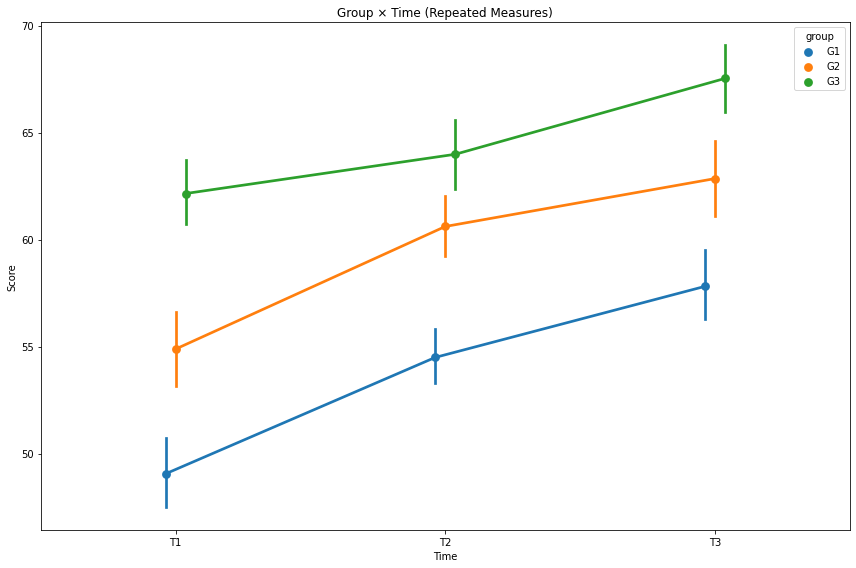
In the mixed ANOVA, the main effect of group was significant (F(2,147) = 96.43, p < .001, η² = .57), indicating substantial differences among the three groups.
The main effect of time was also significant (F(2,294) = 78.37, p < .001, η² = .35), showing that scores changed meaningfully across the three time points.
Additionally, the group × time interaction was significant (F(4,294) = 2.64, p = .034), suggesting that the pattern of change over time differed across groups.
Figure
plt.figure(figsize=(12,8))
sns.pointplot(data=df, x='time', y='score', hue='group', dodge=True)
plt.title('Group × Time (Repeated Measures)')
plt.xlabel('Time')
plt.ylabel('Score')
plt.tight_layout()
plt.show()