import pandas as pd
import numpy as np
# visualization
import matplotlib.pyplot as plt
import seaborn as sns
import plotly.express as px
from sklearn.preprocessing import LabelEncoder
from sklearn.model_selection import train_test_split
from sklearn.ensemble import RandomForestClassifier
from sklearn.metrics import classification_report, confusion_matrix
from xgboost import XGBClassifier
from xgboost import XGBRegressor
from kmodes.kprototypes import KPrototypes
from sklearn.decomposition import PCA
# stat
import scipy.stats as stats
from scipy.stats import spearmanr
import statsmodels.api as sm
from scipy.stats import levene
from sklearn.metrics import mean_squared_error, r2_score
from xgboost import plot_importance
from scipy.stats import chi2_contingency- The “OCD Patient Dataset: Demographics & Clinical Data” is a comprehensive collection of information pertaining to 1500 individuals diagnosed with Obsessive-Compulsive Disorder (OCD). This dataset encompasses a wide range of parameters, providing a detailed insight into the demographic and clinical profiles of these individuals.
- Included in this dataset are key demographic details such as age, gender, ethnicity, marital status, and education level, offering a comprehensive overview of the sample population. Additionally, clinical information like the date of OCD diagnosis, duration of symptoms, and any previous psychiatric diagnoses are recorded, providing context to the patients’ journeys.
- The dataset also delves into the specific nature of OCD symptoms, categorizing them into obsession and compulsion types. Severity of these symptoms is assessed using the Yale-Brown Obsessive-Compulsive Scale (Y-BOCS) scores for both obsessions and compulsions. Furthermore, it documents any co-occurring mental health conditions, including depression and anxiety diagnoses.
- Notably, the dataset outlines the medications prescribed to patients, offering valuable insights into the treatment approaches employed. It also records whether there is a family history of OCD, shedding light on potential genetic or environmental factors.
- Overall, this dataset serves as a valuable resource for researchers, clinicians, and mental health professionals seeking to gain a deeper understanding of OCD and its manifestations within a diverse patient population.
Import
Data
df = pd.read_csv('../../../delete/ocd_patient_dataset.csv')df.head()| Patient ID | Age | Gender | Ethnicity | Marital Status | Education Level | OCD Diagnosis Date | Duration of Symptoms (months) | Previous Diagnoses | Family History of OCD | Obsession Type | Compulsion Type | Y-BOCS Score (Obsessions) | Y-BOCS Score (Compulsions) | Depression Diagnosis | Anxiety Diagnosis | Medications | |
|---|---|---|---|---|---|---|---|---|---|---|---|---|---|---|---|---|---|
| 0 | 1018 | 32 | Female | African | Single | Some College | 2016-07-15 | 203 | MDD | No | Harm-related | Checking | 17 | 10 | Yes | Yes | SNRI |
| 1 | 2406 | 69 | Male | African | Divorced | Some College | 2017-04-28 | 180 | None | Yes | Harm-related | Washing | 21 | 25 | Yes | Yes | SSRI |
| 2 | 1188 | 57 | Male | Hispanic | Divorced | College Degree | 2018-02-02 | 173 | MDD | No | Contamination | Checking | 3 | 4 | No | No | Benzodiazepine |
| 3 | 6200 | 27 | Female | Hispanic | Married | College Degree | 2014-08-25 | 126 | PTSD | Yes | Symmetry | Washing | 14 | 28 | Yes | Yes | SSRI |
| 4 | 5824 | 56 | Female | Hispanic | Married | High School | 2022-02-20 | 168 | PTSD | Yes | Hoarding | Ordering | 39 | 18 | No | No | None |
df.columnsIndex(['Patient ID', 'Age', 'Gender', 'Ethnicity', 'Marital Status',
'Education Level', 'OCD Diagnosis Date',
'Duration of Symptoms (months)', 'Previous Diagnoses',
'Family History of OCD', 'Obsession Type', 'Compulsion Type',
'Y-BOCS Score (Obsessions)', 'Y-BOCS Score (Compulsions)',
'Depression Diagnosis', 'Anxiety Diagnosis', 'Medications'],
dtype='object')df.info()<class 'pandas.core.frame.DataFrame'>
RangeIndex: 1500 entries, 0 to 1499
Data columns (total 17 columns):
# Column Non-Null Count Dtype
--- ------ -------------- -----
0 Patient ID 1500 non-null int64
1 Age 1500 non-null int64
2 Gender 1500 non-null object
3 Ethnicity 1500 non-null object
4 Marital Status 1500 non-null object
5 Education Level 1500 non-null object
6 OCD Diagnosis Date 1500 non-null object
7 Duration of Symptoms (months) 1500 non-null int64
8 Previous Diagnoses 1500 non-null object
9 Family History of OCD 1500 non-null object
10 Obsession Type 1500 non-null object
11 Compulsion Type 1500 non-null object
12 Y-BOCS Score (Obsessions) 1500 non-null int64
13 Y-BOCS Score (Compulsions) 1500 non-null int64
14 Depression Diagnosis 1500 non-null object
15 Anxiety Diagnosis 1500 non-null object
16 Medications 1500 non-null object
dtypes: int64(5), object(12)
memory usage: 199.3+ KBVisualization
- Age Histogram
plt.figure(figsize=(10,6))
plt.hist(df['Age'].dropna(), bins=20)
plt.xlabel('Age')
plt.ylabel('Frequency')
plt.title('Age Distribution')
plt.show()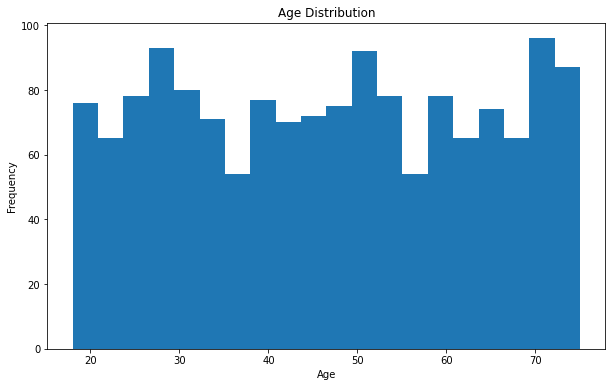
fig = px.histogram(df, x="Age",
                   nbins=20,
                   title="Age Distribution",
                   labels={"Age": "Age"},
                  width=800, height=600)
fig.show()- Gender, Ethnicity & Y-BOCS Score
df.Gender.value_counts()Male 753
Female 747
Name: Gender, dtype: int64df.Ethnicity.value_counts()Caucasian 398
Hispanic 392
Asian 386
African 324
Name: Ethnicity, dtype: int64df['Y-BOCS Score (Obsessions)'].mean()20.048df['Y-BOCS Score (Compulsions)'].mean()19.626- almost the same
df.boxplot(column=['Y-BOCS Score (Obsessions)','Y-BOCS Score (Compulsions)'], by='Gender', figsize=(12,6), grid=False);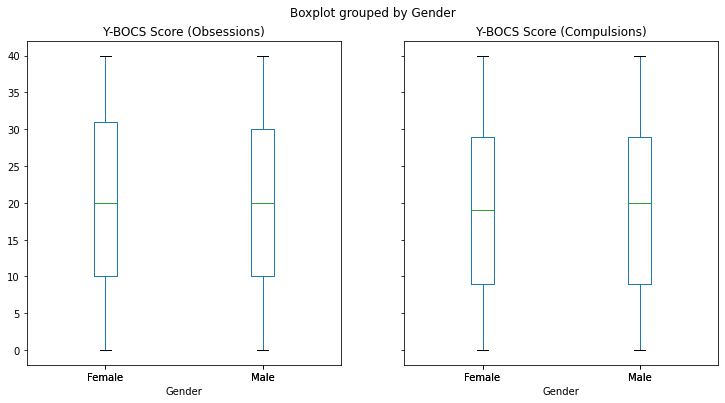
df_long = pd.melt(
    df,
    id_vars='Gender',
    value_vars=['Y-BOCS Score (Obsessions)', 'Y-BOCS Score (Compulsions)'],
    var_name='Score_Type',
    value_name='Score'
)
fig = px.box(
    df_long,
    x="Gender",
    y="Score",
    color="Score_Type",
    title="Gender-wise Obsessions & Compulsions Scores",
    width=1000,
    height=500
)

fig.show()df.boxplot(column=['Y-BOCS Score (Obsessions)','Y-BOCS Score (Compulsions)'], by='Ethnicity', figsize=(14,6), grid=False);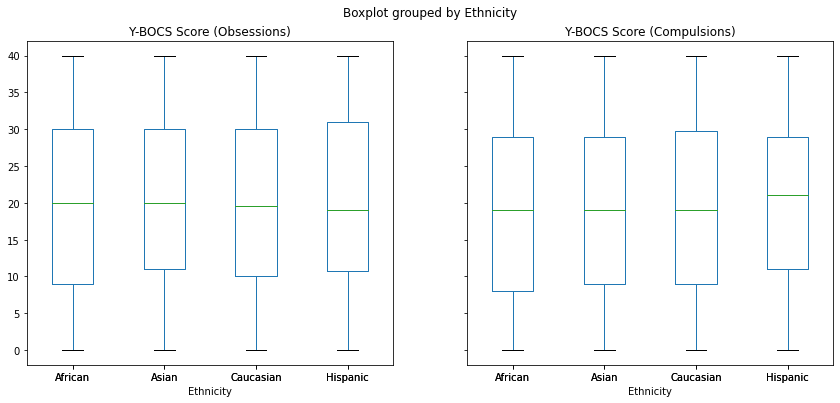
df_long = pd.melt(
    df,
    id_vars='Ethnicity',
    value_vars=['Y-BOCS Score (Obsessions)', 'Y-BOCS Score (Compulsions)'],
    var_name='Score_Type',
    value_name='Score'
)
fig = px.box(
    df_long,
    x="Ethnicity",
    y="Score",
    color="Score_Type",
    title="Gender-wise Obsessions & Compulsions Scores",
    width=1000,
    height=500
)

fig.show()- Obsession Type & Compulsion Type
df['Obsession Type'].value_counts()Harm-related 333
Contamination 306
Religious 303
Symmetry 280
Hoarding 278
Name: Obsession Type, dtype: int64df['Compulsion Type'].value_counts()Washing 321
Counting 316
Checking 292
Praying 286
Ordering 285
Name: Compulsion Type, dtype: int64plt.figure(figsize=(10,6))
plt.bar(df['Obsession Type'].value_counts().index, df['Obsession Type'].value_counts().values)
plt.title('Distribution of Obsession Types')
plt.xlabel('Obsession Type')
plt.ylabel('Count')
plt.show()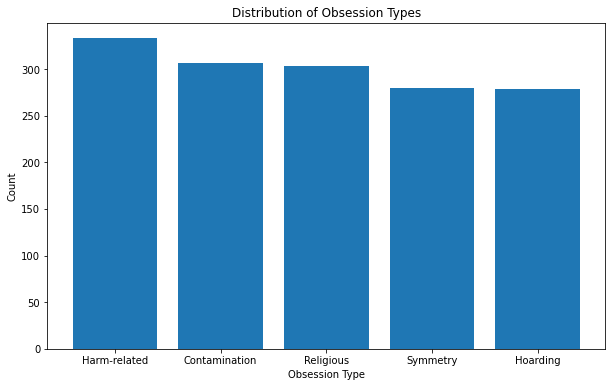
fig = px.histogram(
    df,
    x="Obsession Type",
    title="Distribution of Obsession Types",
    width=900, height=500
)
fig.update_xaxes(categoryorder='total descending')
fig.show()plt.figure(figsize=(10,6))
plt.bar(df['Compulsion Type'].value_counts().index, df['Compulsion Type'].value_counts().values)
plt.title('Distribution of Compulsion Types')
plt.xlabel('Compulsion Type')
plt.ylabel('Count')
plt.show()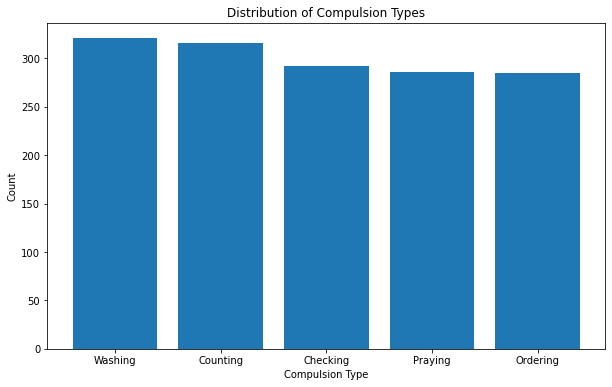
fig = px.histogram(
    df,
    x="Compulsion Type",
    title="Distribution of Compulsion Types",
    width=900, height=500
)
fig.update_xaxes(categoryorder='total descending')
fig.show()
Clinical Characteristics
- Y-BOCS Score, Obsessions+Compulsions, deviation of severity (0–7: Mild, 8–15: Moderate …)
df['Y-BOCS Score (Total)'] = df['Y-BOCS Score (Obsessions)'] + df['Y-BOCS Score (Compulsions)']def classify_severity(score):
if score <= 7:
return 'Mild'
elif score <= 15:
return 'Moderate'
elif score <= 23:
return 'Moderately Severe'
elif score <= 31:
return 'Severe'
else:
return 'Extreme'df['Severity'] = df['Y-BOCS Score (Total)'].apply(classify_severity)df['Severity'].value_counts()Extreme 1012
Severe 210
Moderately Severe 147
Moderate 92
Mild 39
Name: Severity, dtype: int64df.head()| Patient ID | Age | Gender | Ethnicity | Marital Status | Education Level | OCD Diagnosis Date | Duration of Symptoms (months) | Previous Diagnoses | Family History of OCD | Obsession Type | Compulsion Type | Y-BOCS Score (Obsessions) | Y-BOCS Score (Compulsions) | Depression Diagnosis | Anxiety Diagnosis | Medications | Y-BOCS Score (Total) | Severity | |
|---|---|---|---|---|---|---|---|---|---|---|---|---|---|---|---|---|---|---|---|
| 0 | 1018 | 32 | Female | African | Single | Some College | 2016-07-15 | 203 | MDD | No | Harm-related | Checking | 17 | 10 | Yes | Yes | SNRI | 27 | Severe |
| 1 | 2406 | 69 | Male | African | Divorced | Some College | 2017-04-28 | 180 | None | Yes | Harm-related | Washing | 21 | 25 | Yes | Yes | SSRI | 46 | Extreme |
| 2 | 1188 | 57 | Male | Hispanic | Divorced | College Degree | 2018-02-02 | 173 | MDD | No | Contamination | Checking | 3 | 4 | No | No | Benzodiazepine | 7 | Mild |
| 3 | 6200 | 27 | Female | Hispanic | Married | College Degree | 2014-08-25 | 126 | PTSD | Yes | Symmetry | Washing | 14 | 28 | Yes | Yes | SSRI | 42 | Extreme |
| 4 | 5824 | 56 | Female | Hispanic | Married | High School | 2022-02-20 | 168 | PTSD | Yes | Hoarding | Ordering | 39 | 18 | No | No | None | 57 | Extreme |
plt.figure(figsize=(10,6))
sns.countplot(data=df, x='Severity', order=['Mild','Moderate','Moderately Severe','Severe','Extreme'])
plt.title('Y-BOCS Severity Distribution')
plt.xlabel('Severity')
plt.ylabel('Count')
plt.show()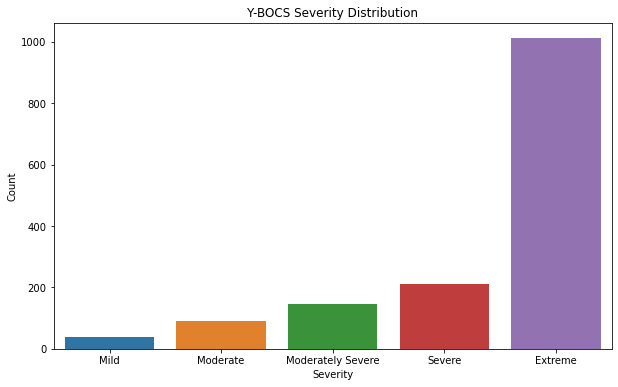
fig = px.histogram(
    df,
    x='Severity',
    category_orders={'Severity': ['Mild','Moderate','Moderately Severe','Severe','Extreme']},
    title='Y-BOCS Severity Distribution',
    width=900, height=500
)

fig.show()- Duration of Symptoms
plt.figure(figsize=(12,6))
plt.hist(df['Duration of Symptoms (months)'], bins=20,)
plt.title('Distribution of OCD Symptom Duration')
plt.xlabel('Duration of Symptoms (months)')
plt.ylabel('Frequency')
plt.show()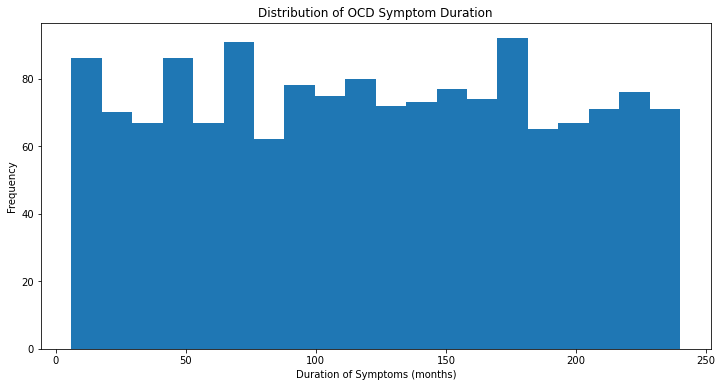
fig = px.histogram(
    df,
    x="Duration of Symptoms (months)",
    nbins=20,
    title="Distribution of OCD Symptom Duration",
    width=900, height=500
)
fig.show()df.boxplot(column='Duration of Symptoms (months)', by='Severity', figsize=(12,6), grid=False)
plt.suptitle('')
plt.title('Symptom Duration by Severity Level')
plt.xlabel('Severity')
plt.ylabel('Duration (months)')
plt.show()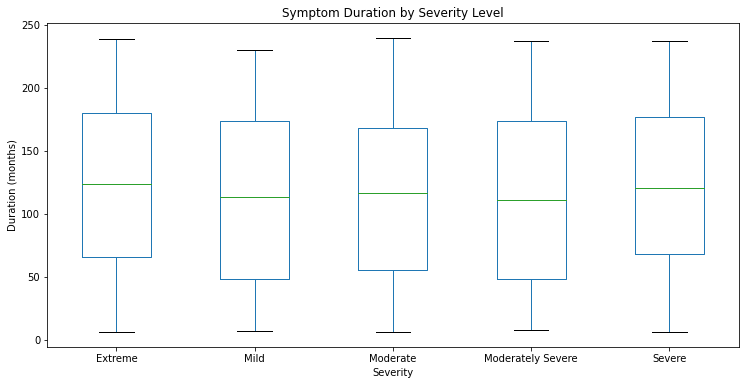
fig = px.box(
    df,
    x="Severity",
    y="Duration of Symptoms (months)",
    category_orders={'Severity': ['Mild','Moderate','Moderately Severe','Severe','Extreme']},
    title="Symptom Duration by Severity",
    width=1000, height=500
)
fig.show()- Previous Diagnoses
df['Previous Diagnoses'].value_counts()MDD 345
Panic Disorder 313
GAD 298
PTSD 296
None 248
Name: Previous Diagnoses, dtype: int64plt.figure(figsize=(8,8))
plt.pie(df['Previous Diagnoses'].value_counts().values, labels=df['Previous Diagnoses'].value_counts().index, autopct='%1.1f%%', startangle=90)
plt.title('Previous Diagnoses Distribution')
plt.show()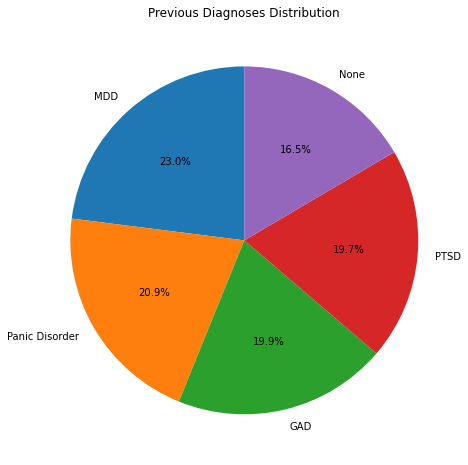
fig = px.pie(
    df,
    names='Previous Diagnoses',
    title='Previous Diagnoses Distribution',
    hole=0
)

fig.update_traces(textposition='inside', textinfo='percent+label')
fig.update_layout(width=600, height=600)

fig.show()- Family History of OCD
df['Family History of OCD'].value_counts()Yes 760
No 740
Name: Family History of OCD, dtype: int64plt.figure(figsize=(7,7))
plt.pie(df['Family History of OCD'].value_counts().values, labels=df['Family History of OCD'].value_counts().index, autopct='%1.1f%%', startangle=90)
plt.title('Family History Distribution')
plt.show()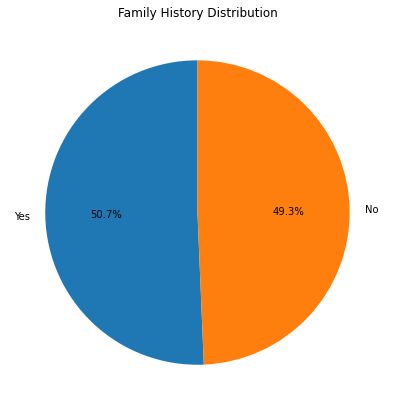
fig = px.pie(
    df,
    names='Family History of OCD',
    title='Family History Distribution',
    hole=0
)

fig.update_traces(textposition='inside', textinfo='percent+label')
fig.update_layout(width=500, height=500)

fig.show()
Categorical Relationships
- Y-BOCS Score, Obsessions+Compulsions
df[['Y-BOCS Score (Obsessions)', 'Y-BOCS Score (Compulsions)']].corr()| Y-BOCS Score (Obsessions) | Y-BOCS Score (Compulsions) | |
|---|---|---|
| Y-BOCS Score (Obsessions) | 1.000000 | 0.030631 |
| Y-BOCS Score (Compulsions) | 0.030631 | 1.000000 |
plt.figure(figsize=(8,6))
sns.regplot(
    x='Y-BOCS Score (Obsessions)',
    y='Y-BOCS Score (Compulsions)',
    data=df
)
plt.title('Regression: Obsessions vs Compulsions')
plt.show()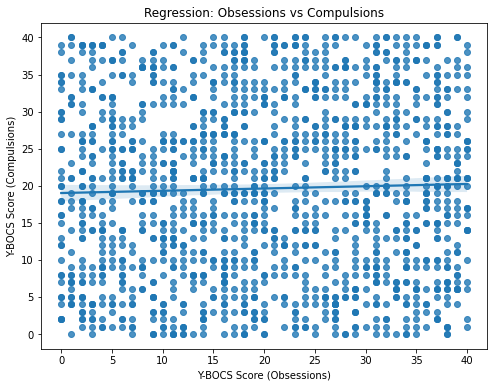
fig = px.scatter(
    df,
    x='Y-BOCS Score (Obsessions)',
    y='Y-BOCS Score (Compulsions)',
    trendline='ols',
    title='Obsessions vs Compulsions Relationship',
width=500, height=500)
fig.show()- Depression Diagnosis, Anxiety Diagnosis & deviation of severity
pd.crosstab(df['Severity'], df['Depression Diagnosis'])| Depression Diagnosis | No | Yes |
|---|---|---|
| Severity | ||
| Extreme | 488 | 524 |
| Mild | 14 | 25 |
| Moderate | 49 | 43 |
| Moderately Severe | 69 | 78 |
| Severe | 108 | 102 |
pd.crosstab(df['Severity'], df['Anxiety Diagnosis'])| Anxiety Diagnosis | No | Yes |
|---|---|---|
| Severity | ||
| Extreme | 513 | 499 |
| Mild | 15 | 24 |
| Moderate | 38 | 54 |
| Moderately Severe | 71 | 76 |
| Severe | 112 | 98 |
plt.figure(figsize=(10,6))
pd.crosstab(df['Severity'], df['Depression Diagnosis']).plot(kind='bar', stacked=False, figsize=(12,6))
plt.title('Severity vs Depression Diagnosis')
plt.xlabel('Severity')
plt.ylabel('Count')
plt.xticks(rotation=30)
plt.show()
<Figure size 720x432 with 0 Axes>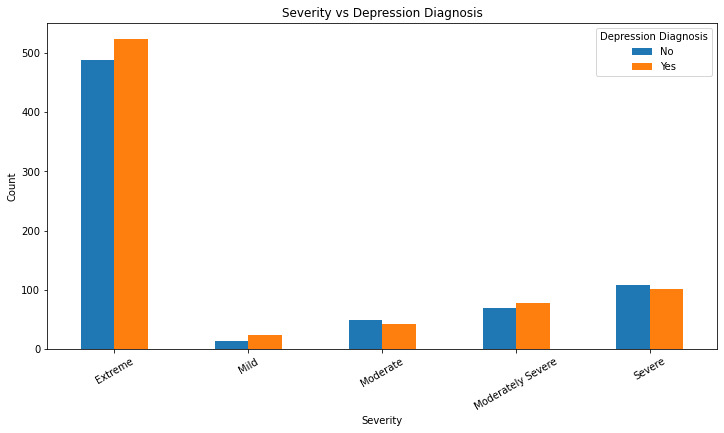
plt.figure(figsize=(10,6))
pd.crosstab(df['Severity'], df['Anxiety Diagnosis']).plot(kind='bar', stacked=False, figsize=(12,6))
plt.title('Severity vs Anxiety Diagnosis')
plt.xlabel('Severity')
plt.ylabel('Count')
plt.xticks(rotation=30)
plt.show()
<Figure size 720x432 with 0 Axes>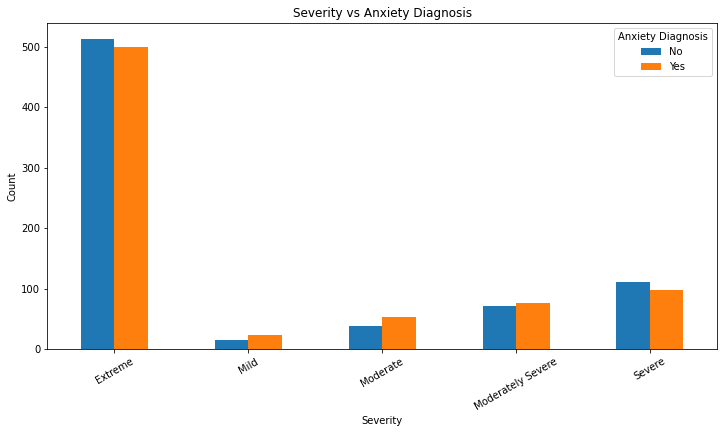
fig = px.histogram(
    df,
    x='Severity',
    color='Depression Diagnosis',
    barmode='stack',
    category_orders={'Severity': ['Mild','Moderate','Moderately Severe','Severe','Extreme']},
    title='Severity vs Depression Diagnosis',
width=1200, height=500
)
fig.show()
fig = px.histogram(
df,
x='Severity',
color='Anxiety Diagnosis',
barmode='stack',
category_orders={'Severity': ['Mild','Moderate','Moderately Severe','Severe','Extreme']},
title='Severity vs Anxiety Diagnosis',
width=1200, height=500
)
fig.show()- Medications & deviation of severity
pd.crosstab(df['Severity'], df['Medications'])| Medications | Benzodiazepine | None | SNRI | SSRI |
|---|---|---|---|---|
| Severity | ||||
| Extreme | 271 | 264 | 246 | 231 |
| Mild | 9 | 10 | 9 | 11 |
| Moderate | 21 | 26 | 21 | 24 |
| Moderately Severe | 39 | 35 | 37 | 36 |
| Severe | 46 | 51 | 63 | 50 |
fig = px.histogram(
    df,
    x='Severity',
    color='Medications',
    barmode='group',
    category_orders={'Severity': ['Mild','Moderate','Moderately Severe','Severe','Extreme']},
    title='Severity vs Medication Use',
width=1200, height=500
)
fig.show()
Regression / Predictive Modeling
- deviation of severity prediction, target=Obsessions+Compulsions
df['Severity'].value_counts()Extreme 1012
Severe 210
Moderately Severe 147
Moderate 92
Mild 39
Name: Severity, dtype: int64df_temp = df.copy()le = LabelEncoder()
df_temp['Severity_label'] = le.fit_transform(df['Severity'])le_x = LabelEncoder()
df_temp['Gender_label'] = le_x.fit_transform(df_temp['Gender'])
df_temp['Ethnicity_label'] = le_x.fit_transform(df_temp['Ethnicity'])
df_temp['Marital Status_label'] = le_x.fit_transform(df_temp['Marital Status'])
df_temp['Education Level_label'] = le_x.fit_transform(df_temp['Education Level'])
df_temp['Previous Diagnoses_label'] = le_x.fit_transform(df_temp['Previous Diagnoses'])
df_temp['Family History of OCD_label'] = le_x.fit_transform(df_temp['Family History of OCD'])
df_temp['Obsession Type_label'] = le_x.fit_transform(df_temp['Obsession Type'])
df_temp['Compulsion Type_label'] = le_x.fit_transform(df_temp['Compulsion Type'])
df_temp['Depression Diagnosis_label'] = le_x.fit_transform(df_temp['Depression Diagnosis'])
df_temp['Anxiety Diagnosis_label'] = le_x.fit_transform(df_temp['Anxiety Diagnosis'])
df_temp['Medications_label'] = le_x.fit_transform(df_temp['Medications'])df_temp.columnsIndex(['Patient ID', 'Age', 'Gender', 'Ethnicity', 'Marital Status',
'Education Level', 'OCD Diagnosis Date',
'Duration of Symptoms (months)', 'Previous Diagnoses',
'Family History of OCD', 'Obsession Type', 'Compulsion Type',
'Y-BOCS Score (Obsessions)', 'Y-BOCS Score (Compulsions)',
'Depression Diagnosis', 'Anxiety Diagnosis', 'Medications',
'Y-BOCS Score (Total)', 'Severity', 'Severity_label', 'Gender_label',
'Ethnicity_label', 'Marital Status_label', 'Education Level_label',
'Previous Diagnoses_label', 'Family History of OCD_label',
'Obsession Type_label', 'Compulsion Type_label',
'Depression Diagnosis_label', 'Anxiety Diagnosis_label',
'Medications_label'],
dtype='object')X = df_temp[['Age', 'Gender_label','Ethnicity_label', 'Marital Status_label', 'Education Level_label',
'Previous Diagnoses_label', 'Family History of OCD_label',
'Obsession Type_label', 'Compulsion Type_label',
'Depression Diagnosis_label', 'Anxiety Diagnosis_label',
'Medications_label','Y-BOCS Score (Obsessions)', 'Y-BOCS Score (Compulsions)',
'Duration of Symptoms (months)']]
y = df_temp['Severity_label']X_train, X_test, y_train, y_test = train_test_split(
X, y, test_size=0.2, random_state=1212, stratify=y)- RandomForestClassifier
model = RandomForestClassifier(
    n_estimators=500,
    max_depth=None,
    class_weight="balanced",
    random_state=1212
)

model.fit(X_train, y_train)
RandomForestClassifier(class_weight='balanced', n_estimators=500,
random_state=1212)In a Jupyter environment, please rerun this cell to show the HTML representation or trust the notebook. On GitHub, the HTML representation is unable to render, please try loading this page with nbviewer.org.
RandomForestClassifier(class_weight='balanced', n_estimators=500,
random_state=1212)pred = model.predict(X_test)pred_label = le.inverse_transform(pred)print(classification_report(y_test, pred)) precision recall f1-score support
0 0.82 1.00 0.90 203
1 1.00 0.75 0.86 8
2 0.80 0.67 0.73 18
3 0.74 0.59 0.65 29
4 0.67 0.14 0.24 42
accuracy 0.81 300
macro avg 0.81 0.63 0.68 300
weighted avg 0.80 0.81 0.77 300
print(confusion_matrix(y_test, pred))[[203 0 0 0 0]
[ 0 6 2 0 0]
[ 0 0 12 6 0]
[ 8 0 1 17 3]
[ 36 0 0 0 6]]- XGBClassifier
model = XGBClassifier(
    objective='multi:softprob',
    num_class=5,
    learning_rate=0.05,
    max_depth=5,
    n_estimators=600,
    subsample=0.8,
    colsample_bytree=0.8,
    eval_metric='mlogloss'
)
model.fit(X_train, y_train)XGBClassifier(base_score=None, booster=None, callbacks=None,
colsample_bylevel=None, colsample_bynode=None,
colsample_bytree=0.8, early_stopping_rounds=None,
enable_categorical=False, eval_metric='mlogloss',
feature_types=None, gamma=None, gpu_id=None, grow_policy=None,
importance_type=None, interaction_constraints=None,
learning_rate=0.05, max_bin=None, max_cat_threshold=None,
max_cat_to_onehot=None, max_delta_step=None, max_depth=5,
max_leaves=None, min_child_weight=None, missing=nan,
monotone_constraints=None, n_estimators=600, n_jobs=None,
num_class=5, num_parallel_tree=None, objective='multi:softprob', ...)In a Jupyter environment, please rerun this cell to show the HTML representation or trust the notebook. On GitHub, the HTML representation is unable to render, please try loading this page with nbviewer.org.
XGBClassifier(base_score=None, booster=None, callbacks=None,
              colsample_bylevel=None, colsample_bynode=None,
              colsample_bytree=0.8, early_stopping_rounds=None,
              enable_categorical=False, eval_metric='mlogloss',
              feature_types=None, gamma=None, gpu_id=None, grow_policy=None,
              importance_type=None, interaction_constraints=None,
              learning_rate=0.05, max_bin=None, max_cat_threshold=None,
              max_cat_to_onehot=None, max_delta_step=None, max_depth=5,
              max_leaves=None, min_child_weight=None, missing=nan,
              monotone_constraints=None, n_estimators=600, n_jobs=None,
num_class=5, num_parallel_tree=None, objective='multi:softprob', ...)pred = model.predict(X_test)pred_label = le.inverse_transform(pred)print(classification_report(y_test, pred)) precision recall f1-score support
0 0.98 0.99 0.99 203
1 1.00 0.88 0.93 8
2 0.76 0.72 0.74 18
3 0.69 0.76 0.72 29
4 0.85 0.79 0.81 42
accuracy 0.92 300
macro avg 0.86 0.83 0.84 300
weighted avg 0.92 0.92 0.92 300
print(confusion_matrix(y_test, pred))[[201 0 0 0 2]
[ 0 7 1 0 0]
[ 0 0 13 5 0]
[ 0 0 3 22 4]
[ 4 0 0 5 33]]- Depression Diagnosis, Anxiety Diagnosis classification, target=Depression Diagnosis
df_temp.columnsIndex(['Patient ID', 'Age', 'Gender', 'Ethnicity', 'Marital Status',
'Education Level', 'OCD Diagnosis Date',
'Duration of Symptoms (months)', 'Previous Diagnoses',
'Family History of OCD', 'Obsession Type', 'Compulsion Type',
'Y-BOCS Score (Obsessions)', 'Y-BOCS Score (Compulsions)',
'Depression Diagnosis', 'Anxiety Diagnosis', 'Medications',
'Y-BOCS Score (Total)', 'Severity', 'Severity_label', 'Gender_label',
'Ethnicity_label', 'Marital Status_label', 'Education Level_label',
'Previous Diagnoses_label', 'Family History of OCD_label',
'Obsession Type_label', 'Compulsion Type_label',
'Depression Diagnosis_label', 'Anxiety Diagnosis_label',
'Medications_label'],
dtype='object')X = df_temp[['Age', 'Gender_label','Ethnicity_label', 'Marital Status_label', 'Education Level_label',
'Previous Diagnoses_label', 'Family History of OCD_label',
'Obsession Type_label', 'Compulsion Type_label',
'Medications_label','Y-BOCS Score (Obsessions)', 'Y-BOCS Score (Compulsions)',
'Duration of Symptoms (months)','Severity_label'
]]y_dep = df_temp['Depression Diagnosis_label']
y_anx = df_temp['Anxiety Diagnosis_label'] def run_binary_model(X, y, name=""):
print(f"\n========== {name} Classification ==========\n")
X_train, X_test, y_train, y_test = train_test_split(
X, y, test_size=0.2, random_state=42, stratify=y
)
model = XGBClassifier(
objective='binary:logistic',
eval_metric='logloss',
learning_rate=0.05,
n_estimators=500,
max_depth=4,
subsample=0.8,
colsample_bytree=0.8,
random_state=1212
)
model.fit(X_train, y_train)
pred = model.predict(X_test)
print(classification_report(y_test, pred))
print("Confusion Matrix:\n", confusion_matrix(y_test, pred))
return modelmodel_dep = run_binary_model(X, y_dep, name="Depression")
========== Depression Classification ==========

              precision    recall  f1-score   support

           0       0.53      0.55      0.54       146
           1       0.56      0.55      0.55       154

    accuracy                           0.55       300
   macro avg       0.55      0.55      0.55       300
weighted avg       0.55      0.55      0.55       300

Confusion Matrix:
 [[80 66]
 [70 84]]
model_anx = run_binary_model(X, y_anx, name="Anxiety")
========== Anxiety Classification ==========

              precision    recall  f1-score   support

           0       0.46      0.44      0.45       150
           1       0.46      0.47      0.47       150

    accuracy                           0.46       300
   macro avg       0.46      0.46      0.46       300
weighted avg       0.46      0.46      0.46       300

Confusion Matrix:
 [[66 84]
 [79 71]]
Cluster Analysis
- Obsession Type, Compulsion Type, Y-BOCS, Duration of Symptoms, Family History of OCD
num_vars = ['Age','Duration of Symptoms (months)','Y-BOCS Score (Obsessions)', 'Y-BOCS Score (Compulsions)']
cat_vars = [ 'Gender', 'Ethnicity', 'Marital Status','Education Level','Previous Diagnoses', 'Family History of OCD', 'Obsession Type',
            'Compulsion Type', 'Depression Diagnosis', 'Anxiety Diagnosis', 'Medications']
X_num = df[num_vars]
X_cat = df[cat_vars]X_cat['Medications'].unique()array(['SNRI', 'SSRI', 'Benzodiazepine', 'None'], dtype=object)X = np.concatenate([X_num.values, X_cat.values], axis=1)kproto = KPrototypes(n_clusters=4, init='Cao', verbose=1)Initialization method and algorithm are deterministic. Setting n_init to 1.clusters = kproto.fit_predict(X, categorical= list(range(len(num_vars), len(num_vars) + len(cat_vars))))Init: initializing centroids
Init: initializing clusters
Starting iterations...
Run: 1, iteration: 1/100, moves: 169, ncost: 1424188.8460787593
Run: 1, iteration: 2/100, moves: 52, ncost: 1419174.8015540848
Run: 1, iteration: 3/100, moves: 16, ncost: 1418485.3782892104
Run: 1, iteration: 4/100, moves: 6, ncost: 1418246.2943452254
Run: 1, iteration: 5/100, moves: 6, ncost: 1418092.0635466345
Run: 1, iteration: 6/100, moves: 4, ncost: 1418032.9034651362
Run: 1, iteration: 7/100, moves: 2, ncost: 1418018.1109047597
Run: 1, iteration: 8/100, moves: 0, ncost: 1418018.1109047597
Init: initializing centroids
Init: initializing clusters
Starting iterations...
Run: 2, iteration: 1/100, moves: 332, ncost: 1818901.0521183137
Run: 2, iteration: 2/100, moves: 252, ncost: 1606120.421828664
Run: 2, iteration: 3/100, moves: 156, ncost: 1533599.9820390644
Run: 2, iteration: 4/100, moves: 129, ncost: 1491503.111472642
Run: 2, iteration: 5/100, moves: 84, ncost: 1472990.931803839
Run: 2, iteration: 6/100, moves: 93, ncost: 1452487.526829172
Run: 2, iteration: 7/100, moves: 61, ncost: 1441171.2094648636
Run: 2, iteration: 8/100, moves: 49, ncost: 1434105.4695059455
Run: 2, iteration: 9/100, moves: 33, ncost: 1430520.0380979755
Run: 2, iteration: 10/100, moves: 42, ncost: 1424693.0178703368
Run: 2, iteration: 11/100, moves: 40, ncost: 1419966.416861994
Run: 2, iteration: 12/100, moves: 26, ncost: 1418168.9624435117
Run: 2, iteration: 13/100, moves: 8, ncost: 1417959.0910372809
Run: 2, iteration: 14/100, moves: 3, ncost: 1417916.6992173058
Run: 2, iteration: 15/100, moves: 0, ncost: 1417916.6992173058
Init: initializing centroids
Init: initializing clusters
Starting iterations...
Run: 3, iteration: 1/100, moves: 350, ncost: 1503703.8182119925
Run: 3, iteration: 2/100, moves: 144, ncost: 1466490.1660129533
Run: 3, iteration: 3/100, moves: 70, ncost: 1450024.645657688
Run: 3, iteration: 4/100, moves: 58, ncost: 1439511.4702249437
Run: 3, iteration: 5/100, moves: 46, ncost: 1433032.8467548355
Run: 3, iteration: 6/100, moves: 29, ncost: 1429979.0952591486
Run: 3, iteration: 7/100, moves: 42, ncost: 1423962.003749793
Run: 3, iteration: 8/100, moves: 36, ncost: 1419853.2690122325
Run: 3, iteration: 9/100, moves: 25, ncost: 1418168.9624435117
Run: 3, iteration: 10/100, moves: 8, ncost: 1417959.0910372809
Run: 3, iteration: 11/100, moves: 3, ncost: 1417916.6992173058
Run: 3, iteration: 12/100, moves: 0, ncost: 1417916.6992173058
Init: initializing centroids
Init: initializing clusters
Starting iterations...
Run: 4, iteration: 1/100, moves: 527, ncost: 1489968.8931082978
Run: 4, iteration: 2/100, moves: 127, ncost: 1459065.995237817
Run: 4, iteration: 3/100, moves: 71, ncost: 1444342.6209097798
Run: 4, iteration: 4/100, moves: 58, ncost: 1435007.272541875
Run: 4, iteration: 5/100, moves: 36, ncost: 1431030.915337287
Run: 4, iteration: 6/100, moves: 37, ncost: 1426133.7181107432
Run: 4, iteration: 7/100, moves: 45, ncost: 1420403.556090177
Run: 4, iteration: 8/100, moves: 28, ncost: 1418258.028009345
Run: 4, iteration: 9/100, moves: 11, ncost: 1417959.0910372809
Run: 4, iteration: 10/100, moves: 3, ncost: 1417916.6992173058
Run: 4, iteration: 11/100, moves: 0, ncost: 1417916.6992173058
Init: initializing centroids
Init: initializing clusters
Starting iterations...
Run: 5, iteration: 1/100, moves: 396, ncost: 1459005.2567074704
Run: 5, iteration: 2/100, moves: 136, ncost: 1423546.5101776381
Run: 5, iteration: 3/100, moves: 48, ncost: 1419617.285502135
Run: 5, iteration: 4/100, moves: 11, ncost: 1419281.5352804312
Run: 5, iteration: 5/100, moves: 3, ncost: 1419249.2677517023
Run: 5, iteration: 6/100, moves: 0, ncost: 1419249.2677517023
Init: initializing centroids
Init: initializing clusters
Starting iterations...
Run: 6, iteration: 1/100, moves: 409, ncost: 1550767.260623612
Run: 6, iteration: 2/100, moves: 181, ncost: 1464134.5064438789
Run: 6, iteration: 3/100, moves: 97, ncost: 1441070.1460857373
Run: 6, iteration: 4/100, moves: 60, ncost: 1431300.0313327508
Run: 6, iteration: 5/100, moves: 48, ncost: 1424020.964177309
Run: 6, iteration: 6/100, moves: 39, ncost: 1420533.9000953294
Run: 6, iteration: 7/100, moves: 19, ncost: 1419393.2782161932
Run: 6, iteration: 8/100, moves: 5, ncost: 1419270.0164454253
Run: 6, iteration: 9/100, moves: 2, ncost: 1419249.2677517023
Run: 6, iteration: 10/100, moves: 0, ncost: 1419249.2677517023
Init: initializing centroids
Init: initializing clusters
Starting iterations...
Run: 7, iteration: 1/100, moves: 275, ncost: 1448900.2187130146
Run: 7, iteration: 2/100, moves: 120, ncost: 1422053.1067257228
Run: 7, iteration: 3/100, moves: 37, ncost: 1419414.705027116
Run: 7, iteration: 4/100, moves: 6, ncost: 1419270.0164454253
Run: 7, iteration: 5/100, moves: 2, ncost: 1419249.2677517023
Run: 7, iteration: 6/100, moves: 0, ncost: 1419249.2677517023
Init: initializing centroids
Init: initializing clusters
Starting iterations...
Run: 8, iteration: 1/100, moves: 305, ncost: 1452861.427862054
Run: 8, iteration: 2/100, moves: 72, ncost: 1438799.4341586914
Run: 8, iteration: 3/100, moves: 46, ncost: 1432029.6503134014
Run: 8, iteration: 4/100, moves: 35, ncost: 1427637.0916138834
Run: 8, iteration: 5/100, moves: 51, ncost: 1420842.5692346364
Run: 8, iteration: 6/100, moves: 33, ncost: 1418258.028009345
Run: 8, iteration: 7/100, moves: 11, ncost: 1417959.0910372809
Run: 8, iteration: 8/100, moves: 3, ncost: 1417916.6992173058
Run: 8, iteration: 9/100, moves: 0, ncost: 1417916.6992173058
Init: initializing centroids
Init: initializing clusters
Starting iterations...
Run: 9, iteration: 1/100, moves: 202, ncost: 1706332.2219010284
Run: 9, iteration: 2/100, moves: 139, ncost: 1612734.544870614
Run: 9, iteration: 3/100, moves: 188, ncost: 1464016.441493613
Run: 9, iteration: 4/100, moves: 150, ncost: 1425521.0069856197
Run: 9, iteration: 5/100, moves: 40, ncost: 1420726.1222925233
Run: 9, iteration: 6/100, moves: 20, ncost: 1419393.2782161932
Run: 9, iteration: 7/100, moves: 5, ncost: 1419270.0164454253
Run: 9, iteration: 8/100, moves: 2, ncost: 1419249.2677517023
Run: 9, iteration: 9/100, moves: 0, ncost: 1419249.2677517023
Init: initializing centroids
Init: initializing clusters
Starting iterations...
Run: 10, iteration: 1/100, moves: 355, ncost: 1514859.8645524066
Run: 10, iteration: 2/100, moves: 164, ncost: 1465789.6829868509
Run: 10, iteration: 3/100, moves: 79, ncost: 1446768.7422806867
Run: 10, iteration: 4/100, moves: 55, ncost: 1436971.0254956826
Run: 10, iteration: 5/100, moves: 41, ncost: 1432140.3626108773
Run: 10, iteration: 6/100, moves: 41, ncost: 1426984.468829614
Run: 10, iteration: 7/100, moves: 45, ncost: 1420886.9353581476
Run: 10, iteration: 8/100, moves: 34, ncost: 1418258.028009345
Run: 10, iteration: 9/100, moves: 11, ncost: 1417959.0910372809
Run: 10, iteration: 10/100, moves: 3, ncost: 1417916.6992173058
Run: 10, iteration: 11/100, moves: 0, ncost: 1417916.6992173058
Best run was number 2df['cluster'] = clusterspca = PCA(n_components=2)
components = pca.fit_transform(X_num)plt.figure(figsize=(10,6))
plt.scatter(components[:,0], components[:,1], c=df['cluster'])
plt.title("Cluster Visualization")
plt.show()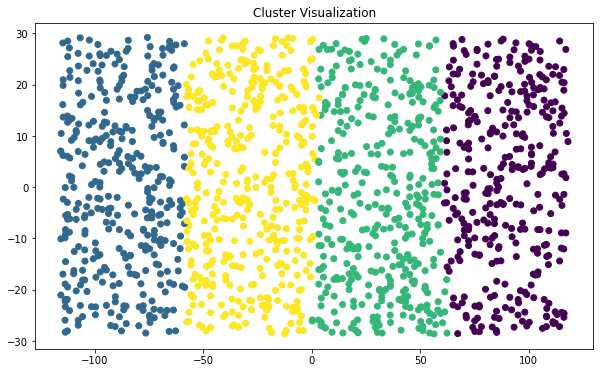
df_plot = pd.DataFrame({
    'PC1': components[:, 0],
    'PC2': components[:, 1],
    'cluster': df['cluster'].astype(str)
})

fig = px.scatter(
    df_plot,
    x='PC1',
    y='PC2',
    color='cluster',
    title='Cluster Visualization (Plotly)',
    width=1000,
    height=600,
    hover_data=df_plot.columns
)

fig.show()
Treatment Pattern
- character comparison by Medications, checking the difference between deviation of severity
le = LabelEncoder()
df['Severity_label'] = le.fit_transform(df['Severity'])df.groupby('Medications')['Severity_label'].agg(['mean', 'std', 'count'])| mean | std | count | |
|---|---|---|---|
| Medications | |||
| Benzodiazepine | 0.911917 | 1.493714 | 386 |
| None | 0.961140 | 1.519071 | 386 |
| SNRI | 1.101064 | 1.615062 | 376 |
| SSRI | 1.042614 | 1.554665 | 352 |
plt.figure(figsize=(12, 6))
plt.boxplot([df[df['Medications'] == med]['Severity_label'] for med in df['Medications'].unique()],
            labels=df['Medications'].unique(), patch_artist=True)

plt.title('Severity Distribution by Medications')
plt.xlabel('Medications')
plt.ylabel('Severity Label')
Text(0, 0.5, 'Severity Label')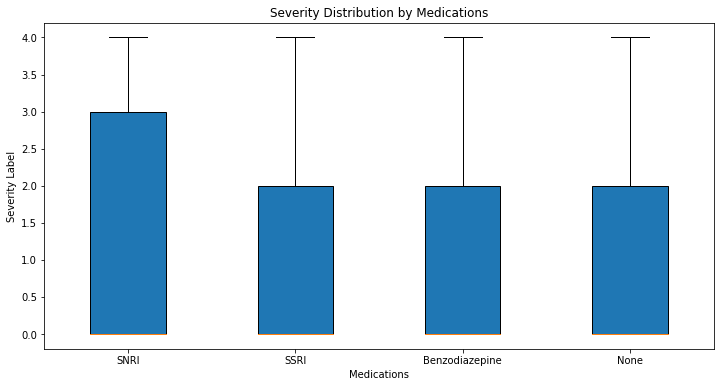
fig = px.box(
    df,
    x='Medications',
    y='Severity_label',
    color='Medications',
    title='Severity Distribution by Medications',
    width=1000,
    height=600,
)
fig.show()
from scipy.stats import kruskalgroups = [df[df['Medications']==m]['Severity_label'] for m in df['Medications'].unique()]
kruskal(*groups)KruskalResult(statistic=3.2409087083255397, pvalue=0.3559520915910378)import scikit_posthocs as spsp.posthoc_dunn(df, val_col='Severity_label', group_col='Medications', p_adjust='bonferroni')| Benzodiazepine | None | SNRI | SSRI | |
|---|---|---|---|---|
| Benzodiazepine | 1.000000 | 1.0 | 0.625534 | 1.0 |
| None | 1.000000 | 1.0 | 1.000000 | 1.0 |
| SNRI | 0.625534 | 1.0 | 1.000000 | 1.0 |
| SSRI | 1.000000 | 1.0 | 1.000000 | 1.0 |
- relationships between Depression Diagnosis, Anxiety Diagnosis & Medications
pd.crosstab(df['Medications'], df['Depression Diagnosis'])| Depression Diagnosis | No | Yes |
|---|---|---|
| Medications | ||
| Benzodiazepine | 180 | 206 |
| None | 215 | 171 |
| SNRI | 172 | 204 |
| SSRI | 161 | 191 |
pd.crosstab(df['Medications'], df['Anxiety Diagnosis'])| Anxiety Diagnosis | No | Yes |
|---|---|---|
| Medications | ||
| Benzodiazepine | 199 | 187 |
| None | 178 | 208 |
| SNRI | 191 | 185 |
| SSRI | 181 | 171 |
chi2, p, dof, expected = stats.chi2_contingency(pd.crosstab(df['Medications'], df['Depression Diagnosis']))
print("Depression x Medications p-value:", round(p,4))
Depression x Medications p-value: 0.0131depression and medication has a relationship.
pd.crosstab(df['Medications'], df['Depression Diagnosis']).plot(kind='bar', stacked=True, figsize=(10,6))
plt.title("Depression Diagnosis by Medications")
plt.xlabel("Medications")
plt.ylabel("Count")
plt.show()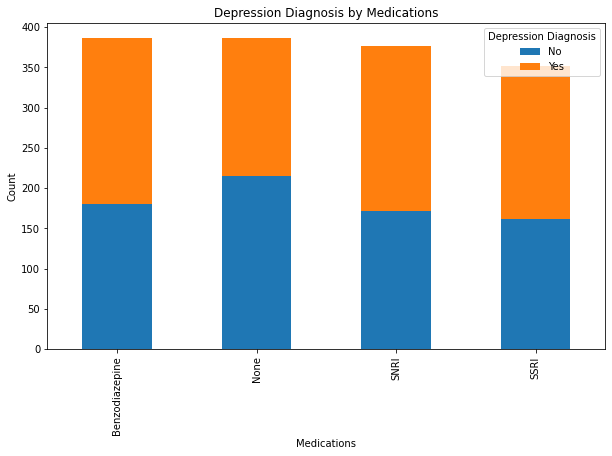
chi2, p, dof, expected = stats.chi2_contingency(pd.crosstab(df['Medications'], df['Anxiety Diagnosis']))
print("Anxiety x Medications p-value:", round(p,4))
Anxiety x Medications p-value: 0.3792anxiety and medication dosen’t have a relationship.
pd.crosstab(df['Medications'], df['Anxiety Diagnosis']).plot(kind='bar', stacked=True, figsize=(10,6))
plt.title("Anxiety Diagnosis by Medications")
plt.xlabel("Medications")
plt.ylabel("Count")
plt.show()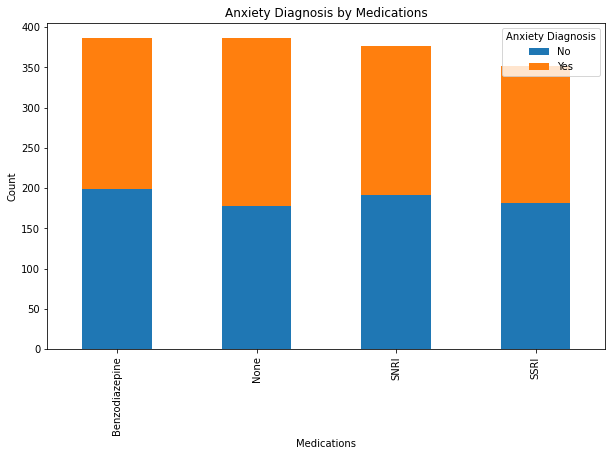
Symptom trajectory
- Duration of Symptoms & deviation of severity
df.groupby('Severity')['Duration of Symptoms (months)'].agg(['mean','std','count']).round(2)| mean | std | count | |
|---|---|---|---|
| Severity | |||
| Extreme | 123.85 | 67.08 | 1012 |
| Mild | 115.46 | 71.62 | 39 |
| Moderate | 113.48 | 69.30 | 92 |
| Moderately Severe | 115.10 | 68.56 | 147 |
| Severe | 121.06 | 66.51 | 210 |
plt.figure(figsize=(14,8))
plt.boxplot(
    [df[df['Severity_label']==s]['Duration of Symptoms (months)'] for s in sorted(df['Severity_label'].unique())],
    labels=sorted(df['Severity_label'].unique())
)

plt.title("Duration of Symptoms by Severity")
plt.xlabel("Severity")
plt.ylabel("Duration of Symptoms (months)")
plt.show()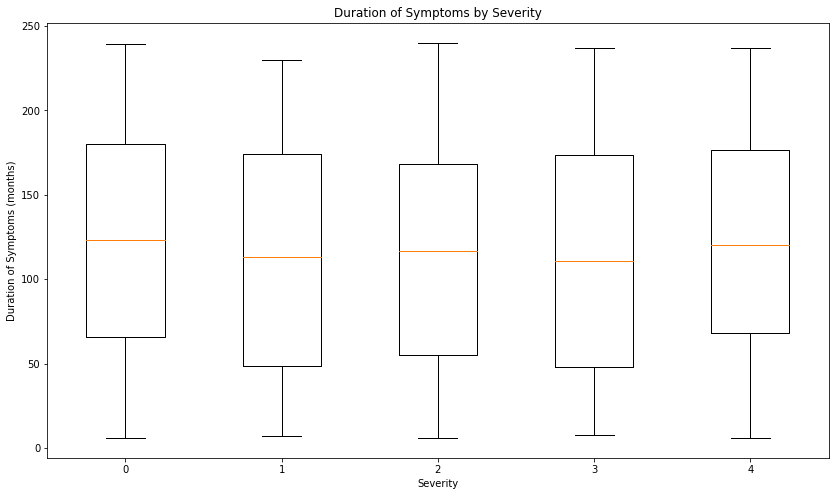
rho, p = spearmanr(df['Duration of Symptoms (months)'], df['Severity_label'])
print(round(rho,4), round(p,4))
-0.0387 0.1337X = sm.add_constant(df['Duration of Symptoms (months)'])
y = df['Severity_label']model = sm.OLS(y, X).fit()print(model.summary()) OLS Regression Results
==============================================================================
Dep. Variable: Severity_label R-squared: 0.001
Model: OLS Adj. R-squared: 0.000
Method: Least Squares F-statistic: 1.707
Date: Sun, 16 Nov 2025 Prob (F-statistic): 0.192
Time: 07:17:48 Log-Likelihood: -2780.4
No. Observations: 1500 AIC: 5565.
Df Residuals: 1498 BIC: 5575.
Df Model: 1
Covariance Type: nonrobust
=================================================================================================
coef std err t P>|t| [0.025 0.975]
-------------------------------------------------------------------------------------------------
const 1.0969 0.082 13.311 0.000 0.935 1.259
Duration of Symptoms (months) -0.0008 0.001 -1.307 0.192 -0.002 0.000
==============================================================================
Omnibus: 246.775 Durbin-Watson: 2.045
Prob(Omnibus): 0.000 Jarque-Bera (JB): 306.988
Skew: 1.066 Prob(JB): 2.18e-67
Kurtosis: 2.392 Cond. No. 287.
==============================================================================
Notes:
[1] Standard Errors assume that the covariance matrix of the errors is correctly specified.df.groupby('Severity_label')['Duration of Symptoms (months)'].var()Severity_label
0 4499.390655
1 5129.307692
2 4803.065456
3 4699.955270
4 4423.828685
Name: Duration of Symptoms (months), dtype: float64groups = [df[df['Severity_label']==s]['Duration of Symptoms (months)'] for s in df['Severity_label'].unique()]
levene(*groups)LeveneResult(statistic=0.15574666979036633, pvalue=0.9604427033483434)Multi-variable Associations
- Predicting Y-BOCS total score
num_vars = [
    'Age',
    'Duration of Symptoms (months)',
    'Severity_label'
]
y = df['Y-BOCS Score (Total)']
cat_vars = [
    'Gender', 'Ethnicity', 'Marital Status','Education Level',
    'Previous Diagnoses', 'Family History of OCD', 'Obsession Type',
    'Compulsion Type', 'Depression Diagnosis', 'Anxiety Diagnosis', 'Medications'
]

df_dummies = pd.get_dummies(df[num_vars + cat_vars], drop_first=True)

X = df_dummies
X_train, X_test, y_train, y_test = train_test_split(
X, y, test_size=0.2, random_state=42
)model = XGBRegressor(
n_estimators=600,
learning_rate=0.05,
max_depth=5,
subsample=0.8,
colsample_bytree=0.8,
random_state=42
)model.fit(X_train, y_train)XGBRegressor(base_score=None, booster=None, callbacks=None,
colsample_bylevel=None, colsample_bynode=None,
colsample_bytree=0.8, early_stopping_rounds=None,
enable_categorical=False, eval_metric=None, feature_types=None,
gamma=None, gpu_id=None, grow_policy=None, importance_type=None,
interaction_constraints=None, learning_rate=0.05, max_bin=None,
max_cat_threshold=None, max_cat_to_onehot=None,
max_delta_step=None, max_depth=5, max_leaves=None,
min_child_weight=None, missing=nan, monotone_constraints=None,
n_estimators=600, n_jobs=None, num_parallel_tree=None,
predictor=None, random_state=42, ...)In a Jupyter environment, please rerun this cell to show the HTML representation or trust the notebook. On GitHub, the HTML representation is unable to render, please try loading this page with nbviewer.org.
XGBRegressor(base_score=None, booster=None, callbacks=None,
             colsample_bylevel=None, colsample_bynode=None,
             colsample_bytree=0.8, early_stopping_rounds=None,
             enable_categorical=False, eval_metric=None, feature_types=None,
             gamma=None, gpu_id=None, grow_policy=None, importance_type=None,
             interaction_constraints=None, learning_rate=0.05, max_bin=None,
             max_cat_threshold=None, max_cat_to_onehot=None,
             max_delta_step=None, max_depth=5, max_leaves=None,
             min_child_weight=None, missing=nan, monotone_constraints=None,
             n_estimators=600, n_jobs=None, num_parallel_tree=None,
predictor=None, random_state=42, ...)pred = model.predict(X_test)mse = mean_squared_error(y_test, pred)r2 = r2_score(y_test, pred)print("MSE:", round(mse,4))
print("RMSE:", round(mse**0.5,4))
print("R²:", round(r2,4))MSE: 131.9552
RMSE: 11.4872
R²: 0.5511plot_importance(model, max_num_features=20)
plt.title("Top Predictors of Y-BOCS Total Score")
plt.show()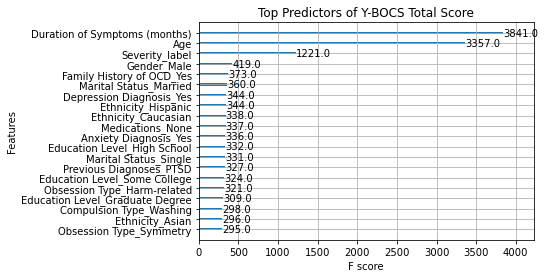
- Family History → Depression/Anxiety diagnosis prediction
pd.crosstab(df['Family History of OCD'], df['Depression Diagnosis'], normalize='index')| Depression Diagnosis | No | Yes |
|---|---|---|
| Family History of OCD | ||
| No | 0.478378 | 0.521622 |
| Yes | 0.492105 | 0.507895 |
pd.crosstab(df['Family History of OCD'], df['Anxiety Diagnosis'], normalize='index')| Anxiety Diagnosis | No | Yes |
|---|---|---|
| Family History of OCD | ||
| No | 0.493243 | 0.506757 |
| Yes | 0.505263 | 0.494737 |
dep_table = pd.crosstab(df['Family History of OCD'], df['Depression Diagnosis'])anx_table = pd.crosstab(df['Family History of OCD'], df['Anxiety Diagnosis'])print(chi2_contingency(dep_table)) (0.23054877744934138, 0.6311172165335022, 1, array([[359.14666667, 380.85333333],
[368.85333333, 391.14666667]]))print(chi2_contingency(anx_table))(0.17126678147759677, 0.6789884242062061, 1, array([[369.50666667, 370.49333333],
[379.49333333, 380.50666667]]))