import pandas as pd
import numpy as np
from sklearn.model_selection import train_test_split
from sklearn.linear_model import LinearRegression, LogisticRegression
from sklearn.metrics import r2_score, mean_squared_error, accuracy_score, classification_report, confusion_matrix
from sklearn.ensemble import RandomForestClassifier
import matplotlib.pyplot as plt
import plotly.express as px
from sklearn.preprocessing import LabelEncoderData
- This synthetic yet realistic dataset evaluates individuals’ overall well-being based on multiple physical and lifestyle factors. Each row represents a person’s health and lifestyle attributes, scored from real-world patterns, to predict an Overall Health Score (0–100).
- Columns
| Column Name | Description | Type | Example |
|---|---|---|---|
| Physical_Activity | Minutes of moderate to vigorous exercise per day (0–120) | Numeric | 45 |
| Nutrition_Score | Diet quality (0–10) based on nutrient density, balance, and variety | Numeric | 8 |
| Stress_Level | Self-reported stress (1–10), where 10 = very high stress | Numeric | 6 |
| Mindfulness | Minutes per day spent in meditation, journaling, or mindful activity (0–60) | Numeric | 10 |
| Sleep_Hours | Average hours of sleep per night (3–10) | Numeric | 7.5 |
| Hydration | Liters of water consumed per day (0.5–5.0) | Numeric | 2.8 |
| BMI | Body Mass Index (18–40) | Numeric | 24.3 |
| Alcohol | Units of alcohol per week (0–20) | Numeric | 3 |
| Smoking | Cigarettes per day (0–30) | Numeric | 5 |
- Regression → Predict Overall_Health_Score
- Classification → Create Health_Status label (e.g., “Poor”, “Average”, “Good”)
- Feature Importance → Which lifestyle factor affects health most
- Dashboard → Build interactive visualizations in Streamlit or Plotly Dash
df = pd.read_csv('../../../delete/holistic_health_lifestyle_dataset.csv')df.head()| Physical_Activity | Nutrition_Score | Stress_Level | Mindfulness | Sleep_Hours | Hydration | BMI | Alcohol | Smoking | Overall_Health_Score | Health_Status | |
|---|---|---|---|---|---|---|---|---|---|---|---|
| 0 | 54.934283 | 5.643011 | 5.696572 | 0.000000 | 6.292214 | 2.578565 | 24.275932 | 4.280610 | 8.984006 | 36.950187 | Poor |
| 1 | 42.234714 | 6.389001 | 5.566647 | 4.450144 | 8.519054 | 2.448713 | 25.970141 | 7.461846 | 3.223304 | 55.167774 | Average |
| 2 | 57.953771 | 5.805238 | 3.126960 | 9.129716 | 6.702720 | 3.261433 | 25.193857 | 0.000000 | 4.600482 | 78.304426 | Good |
| 3 | 75.460597 | 7.220836 | 6.159168 | 16.496689 | 7.135854 | 3.726265 | 19.527300 | 9.958423 | 3.947706 | 94.018274 | Good |
| 4 | 40.316933 | 9.394357 | 2.019835 | 25.241623 | 8.076086 | 3.049478 | 23.348229 | 4.320347 | 8.084322 | 100.000000 | Good |
df.info()<class 'pandas.core.frame.DataFrame'>
RangeIndex: 10000 entries, 0 to 9999
Data columns (total 11 columns):
# Column Non-Null Count Dtype
--- ------ -------------- -----
0 Physical_Activity 10000 non-null float64
1 Nutrition_Score 10000 non-null float64
2 Stress_Level 10000 non-null float64
3 Mindfulness 10000 non-null float64
4 Sleep_Hours 10000 non-null float64
5 Hydration 10000 non-null float64
6 BMI 10000 non-null float64
7 Alcohol 10000 non-null float64
8 Smoking 10000 non-null float64
9 Overall_Health_Score 10000 non-null float64
10 Health_Status 10000 non-null object
dtypes: float64(10), object(1)
memory usage: 859.5+ KBRegression → Predict Overall_Health_Score
X = df.drop(['Overall_Health_Score','Health_Status'],axis=1)
y = df['Overall_Health_Score']X_train, X_test, y_train, y_test = train_test_split(X,y,test_size=0.4, random_state=1212)model = LinearRegression()model.fit(X_train, y_train)LinearRegression()In a Jupyter environment, please rerun this cell to show the HTML representation or trust the notebook.
On GitHub, the HTML representation is unable to render, please try loading this page with nbviewer.org.
LinearRegression()
y_pred = model.predict(X_test)y_predarray([ 54.80081517, 87.5517459 , 106.87897538, ..., 85.6034847 ,
76.16164305, 43.69768659])r2 = r2_score(y_test,y_pred)round(r2,4)0.9053rmse = np.sqrt(mean_squared_error(y_test,y_pred))round(rmse,4)6.1302plt.figure(figsize=(12,6))
plt.plot(y_test,y_pred,'.')
plt.plot([y.min(), y.max()],[y.min(), y.max()],'k--')
plt.xlabel('Actual Overall Health Score')
plt.ylabel('Predicted Overall Health Score')
plt.title('Actual vs Predicted (Linear Regression)')Text(0.5, 1.0, 'Actual vs Predicted (Linear Regression)')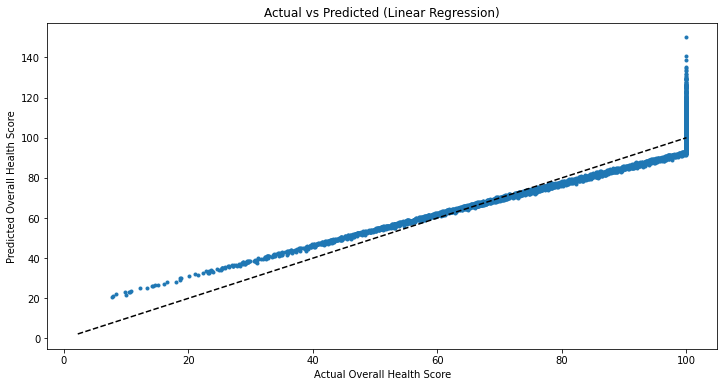
fig = px.scatter(
x = y_test,
y=y_pred,
labels={'x':'Actual Overall Health Score', 'y':'Predicted Overall Health Score'},
title='Actual vs Predicted (Interaction)',
width=1000,
height=600,
template='seaborn'
)
fig.add_shape(
type = 'line',
x0=y.min(), y0=y.min(),
x1=y.max(), y1=y.max(),
line=dict(dash='dash')
)
figpd.DataFrame({'feature':X.columns,
'Coefficient':model.coef_})| feature | Coefficient | |
|---|---|---|
| 0 | Physical_Activity | 0.157633 |
| 1 | Nutrition_Score | 3.954692 |
| 2 | Stress_Level | -1.509945 |
| 3 | Mindfulness | 1.508616 |
| 4 | Sleep_Hours | 2.342065 |
| 5 | Hydration | 3.877228 |
| 6 | BMI | -0.961926 |
| 7 | Alcohol | -1.198366 |
| 8 | Smoking | -1.216072 |
fig = px.bar(
pd.DataFrame({'feature':X.columns,
'Coefficient':model.coef_}).sort_values(by='Coefficient',ascending=False),
x='feature',
y='Coefficient',
title='Feature Importance (Linear Regression Coefficients)',
width=1200,
height=500,
template='seaborn'
)
fig.update_traces(textfont_size=10)
figClassification
df.columnsIndex(['Physical_Activity', 'Nutrition_Score', 'Stress_Level', 'Mindfulness',
'Sleep_Hours', 'Hydration', 'BMI', 'Alcohol', 'Smoking',
'Overall_Health_Score', 'Health_Status'],
dtype='object')feature_cols = ['Physical_Activity', 'Nutrition_Score', 'Stress_Level', 'Mindfulness',
'Sleep_Hours', 'Hydration', 'BMI', 'Alcohol', 'Smoking']
target_col = 'Health_Status'X = df[feature_cols]
y = df[target_col]X_train, X_test, y_train, y_test = train_test_split(
X, y,
test_size=0.3,
random_state=1212,
stratify=y
)rf_clf = RandomForestClassifier(
n_estimators = 200,
max_depth = 500,
random_state = 1212
)rf_clf.fit(X_train, y_train)RandomForestClassifier(max_depth=500, n_estimators=200, random_state=1212)In a Jupyter environment, please rerun this cell to show the HTML representation or trust the notebook.
On GitHub, the HTML representation is unable to render, please try loading this page with nbviewer.org.
RandomForestClassifier(max_depth=500, n_estimators=200, random_state=1212)
y_pred = rf_clf.predict(X_test)print(accuracy_score(y_test, y_pred))0.9016666666666666print(classification_report(y_test, y_pred)) precision recall f1-score support
Average 0.82 0.83 0.83 847
Good 0.93 0.96 0.95 2028
Poor 0.96 0.42 0.59 125
accuracy 0.90 3000
macro avg 0.91 0.74 0.79 3000
weighted avg 0.90 0.90 0.90 3000
print(confusion_matrix(y_test, y_pred))[[ 704 141 2]
[ 80 1948 0]
[ 72 0 53]]rf_clf.feature_importances_array([0.05958089, 0.14695664, 0.05456092, 0.39132416, 0.06662972,
0.0553765 , 0.05974965, 0.06450309, 0.10131843])sorted(rf_clf.feature_importances_)[0.054560915836208625,
0.055376503787369434,
0.05958089210684196,
0.05974965275725182,
0.06450308658146583,
0.06662971724764624,
0.10131843171547394,
0.14695663514721352,
0.3913241648205286]df.iloc[y_test.index,:].Health_Status356 Good
8088 Good
2634 Good
9979 Average
6928 Average
...
6364 Good
5786 Average
7395 Average
4825 Good
3079 Average
Name: Health_Status, Length: 3000, dtype: objectle=LabelEncoder()y_test_num = le.fit_transform(y_test)plt.figure(figsize=(10,6))
plt.scatter(X_test.Mindfulness,X_test.Nutrition_Score,c=y_test_num,alpha= 0.6)
plt.xlabel('Mindfulness')
plt.ylabel('Nutrition Score')
plt.title('Mindfulness and Nutrition Score with Health Status')Text(0.5, 1.0, 'Mindfulness and Nutrition Score with Health Status')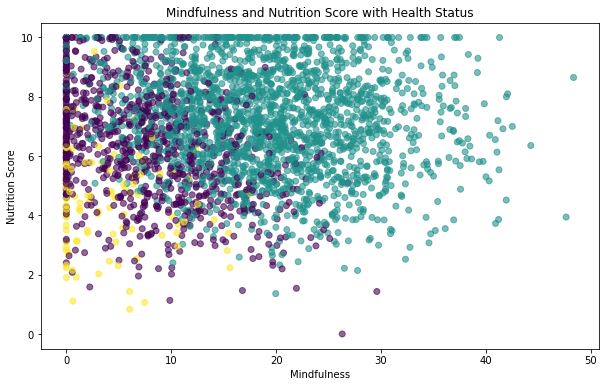
fig = px.scatter(
X_test,
x='Mindfulness',
y='Nutrition_Score',
color=y_test,
opacity=0.6,
labels={'color': 'Health Status'},
title='Mindfulness and Nutrition Score with Health Status',
width=1000,
height=600,
template='seaborn'
)
figy_pred_num = le.fit_transform(y_pred)plt.figure(figsize=(10,6))
plt.scatter(X_test.Mindfulness,X_test.Nutrition_Score,c=y_pred_num,alpha= 0.6)
plt.xlabel('Mindfulness')
plt.ylabel('Nutrition Score')
plt.title('RandomForest Classifiaction for Mindfulness and Nutrition Score with Health Status')Text(0.5, 1.0, 'RandomForest Classifiaction for Mindfulness and Nutrition Score with Health Status')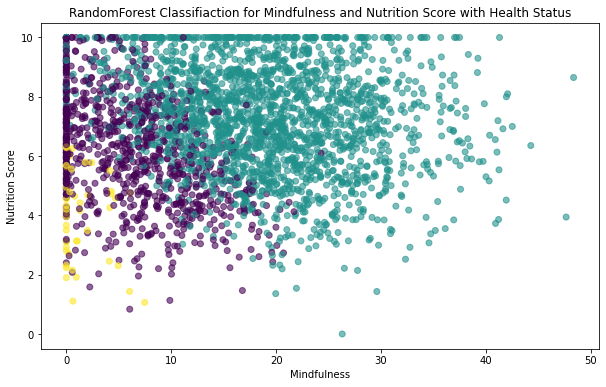
fig = px.scatter(
X_test,
x='Mindfulness',
y='Nutrition_Score',
color=y_pred,
opacity=0.6,
labels={'color': 'Predicted Health Status'},
title='Random Forest for Mindfulness and Nutrition Score with Health Status',
width=1000,
height=600,
template='seaborn'
)
fig- LogisticRegression
log_clf = LogisticRegression(max_iter=1000)log_clf.fit(X_train, y_train)/home/csy/anaconda3/envs/temp_csy/lib/python3.8/site-packages/sklearn/linear_model/_logistic.py:460: ConvergenceWarning:
lbfgs failed to converge (status=1):
STOP: TOTAL NO. of ITERATIONS REACHED LIMIT.
Increase the number of iterations (max_iter) or scale the data as shown in:
https://scikit-learn.org/stable/modules/preprocessing.html
Please also refer to the documentation for alternative solver options:
https://scikit-learn.org/stable/modules/linear_model.html#logistic-regression
LogisticRegression(max_iter=1000)In a Jupyter environment, please rerun this cell to show the HTML representation or trust the notebook.
On GitHub, the HTML representation is unable to render, please try loading this page with nbviewer.org.
LogisticRegression(max_iter=1000)
y_pred = log_clf.predict(X_test)print(accuracy_score(y_test, y_pred))0.995print(classification_report(y_test, y_pred)) precision recall f1-score support
Average 1.00 0.99 0.99 847
Good 1.00 1.00 1.00 2028
Poor 0.98 0.98 0.98 125
accuracy 0.99 3000
macro avg 0.99 0.99 0.99 3000
weighted avg 0.99 0.99 0.99 3000
print(confusion_matrix(y_test, y_pred))[[ 836 9 2]
[ 1 2027 0]
[ 3 0 122]]rf_clf.feature_importances_array([0.05958089, 0.14695664, 0.05456092, 0.39132416, 0.06662972,
0.0553765 , 0.05974965, 0.06450309, 0.10131843])sorted(rf_clf.feature_importances_)[0.054560915836208625,
0.055376503787369434,
0.05958089210684196,
0.05974965275725182,
0.06450308658146583,
0.06662971724764624,
0.10131843171547394,
0.14695663514721352,
0.3913241648205286]y_pred_num = le.fit_transform(y_pred)plt.figure(figsize=(10,6))
plt.scatter(X_test.Mindfulness,X_test.Nutrition_Score,c=y_pred_num,alpha= 0.6)
plt.xlabel('Mindfulness')
plt.ylabel('Nutrition Score')
plt.title('RandomForest Classifiaction for Mindfulness and Nutrition Score with Health Status')Text(0.5, 1.0, 'RandomForest Classifiaction for Mindfulness and Nutrition Score with Health Status')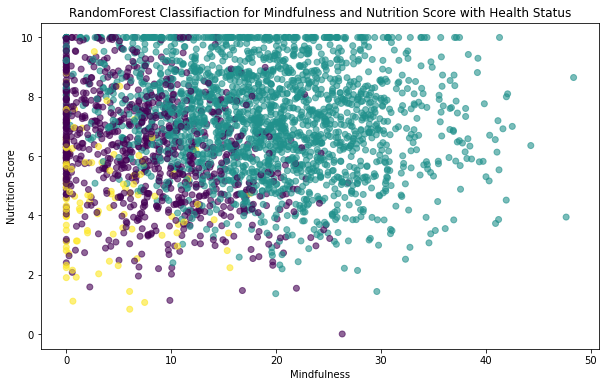
fig = px.scatter(
X_test,
x='Mindfulness',
y='Nutrition_Score',
color=y_pred,
opacity=0.6,
labels={'color': 'Predicted Health Status'},
title='Random Forest for Mindfulness and Nutrition Score with Health Status',
width=1000,
height=600,
template='seaborn'
)
figDashboard
fig = px.bar(
df["Health_Status"].value_counts().reset_index(),
x="index",
y="Health_Status",
labels={"index": "", "Health_Status": "Count"},
title="Health Status",
width=1000,
height=400,
template='seaborn'
)
fig.show()df.corr()FutureWarning:
The default value of numeric_only in DataFrame.corr is deprecated. In a future version, it will default to False. Select only valid columns or specify the value of numeric_only to silence this warning.
| Physical_Activity | Nutrition_Score | Stress_Level | Mindfulness | Sleep_Hours | Hydration | BMI | Alcohol | Smoking | Overall_Health_Score | |
|---|---|---|---|---|---|---|---|---|---|---|
| Physical_Activity | 1.000000 | -0.008942 | 0.023377 | -0.011513 | -0.009958 | -0.021959 | -0.016279 | -0.021592 | 0.004774 | 0.146014 |
| Nutrition_Score | -0.008942 | 1.000000 | 0.027171 | 0.014820 | -0.003984 | 0.000604 | -0.009665 | 0.001983 | -0.003347 | 0.385678 |
| Stress_Level | 0.023377 | 0.027171 | 1.000000 | 0.001435 | 0.008659 | -0.004224 | -0.000406 | -0.013165 | -0.001170 | -0.129315 |
| Mindfulness | -0.011513 | 0.014820 | 0.001435 | 1.000000 | 0.008517 | -0.008026 | 0.014029 | 0.017807 | 0.005669 | 0.715856 |
| Sleep_Hours | -0.009958 | -0.003984 | 0.008659 | 0.008517 | 1.000000 | -0.010928 | 0.008973 | 0.002004 | 0.001971 | 0.171856 |
| Hydration | -0.021959 | 0.000604 | -0.004224 | -0.008026 | -0.010928 | 1.000000 | -0.002795 | 0.013731 | 0.013585 | 0.142044 |
| BMI | -0.016279 | -0.009665 | -0.000406 | 0.014029 | 0.008973 | -0.002795 | 1.000000 | 0.005597 | -0.001867 | -0.160278 |
| Alcohol | -0.021592 | 0.001983 | -0.013165 | 0.017807 | 0.002004 | 0.013731 | 0.005597 | 1.000000 | -0.023092 | -0.174725 |
| Smoking | 0.004774 | -0.003347 | -0.001170 | 0.005669 | 0.001971 | 0.013585 | -0.001867 | -0.023092 | 1.000000 | -0.294431 |
| Overall_Health_Score | 0.146014 | 0.385678 | -0.129315 | 0.715856 | 0.171856 | 0.142044 | -0.160278 | -0.174725 | -0.294431 | 1.000000 |
fig = px.scatter(
df,
x='Smoking',
y='Hydration',
color="Health_Status",
title=f"{x_col} vs {y_col}",
hover_data=["Overall_Health_Score"],
width=1000,
height=600,
template='seaborn'
)
fig.show()fig = px.scatter(
df,
x='Alcohol',
y='Hydration',
color="Health_Status",
title=f"{x_col} vs {y_col}",
hover_data=["Overall_Health_Score"],
width=1000,
height=600,
template='seaborn'
)
fig.show()fig = px.histogram(
df,
x="Overall_Health_Score",
nbins=30,
color="Health_Status",
title="Overall Health Score",
width=1000,
height=400,
template='seaborn'
)
fig.show()fig = px.box(
df,
x="Health_Status",
y="Mindfulness",
color="Health_Status",
title="Sleep Hours by Health Status",
width=1000,
height=400,
template='seaborn'
)
fig.show()fig = px.box(
df,
x="Health_Status",
y="Nutrition_Score",
color="Health_Status",
title="Sleep Hours by Health Status",
width=1000,
height=400,
template='seaborn'
)
fig.show()fig = px.box(
df,
x="Health_Status",
y="Smoking",
color="Health_Status",
title="Sleep Hours by Health Status",
width=1000,
height=400,
template='seaborn'
)
fig.show()